
Debra K. Davenport
Auditor General
Special Audit
Maricopa County
Special Health Care District
Performance Audit Division
March • 2009
REPORT NO. 09-03
A REPORT
TO THE
ARIZONA LEGISLATURE

The
Auditor
General
is appointed by the Joint Legislative Audit Committee, a bipartisan committee composed of five senators
and five representatives. Her mission is to provide independent and impartial information and specific recommendations to
improve the operations of state and local government entities. To this end, she provides financial audits and accounting services
to the State and political subdivisions, investigates possible misuse of public monies, and conducts performance audits of
school districts, state agencies, and the programs they administer.
The Joint Legislative Audit Committee
Audit Staff
Copies of the Auditor General’s reports are free.
You may request them by contacting us at:
Office of the Auditor General
2910 N. 44th Street, Suite 410 • Phoenix, AZ 85018 • (602) 553-0333
Additionally, many of our reports can be found in electronic format at:
www.azauditor.gov
MMeellaanniiee MM.. CChheessnneeyy
, Director
DDoott
RReeiinnhhaarrdd
, Manager and Contact Person
LLoorrii
BBaabbbbiitttt
, Team Leader
EEsstteellllaa
AArrrreeddoonnddoo KKaarrll
KKuulliicckk
BBrriiaann
MMiieellee RRiittaa
SSeettoo
RRoossee
TTaarrbbeellll CChheeyyaa
WWiillssoonn
Senator
TThhaayyeerr
VVeerrsscchhoooorr,,
Chair Representative
JJuuddyy
BBuurrggeess,,
Vice-Chair
Senator
PPaammeellaa
GGoorrmmaann
Representative
TToomm
BBoooonnee
Senator
JJoohhnn
HHuuppppeenntthhaall
Representative
CClloovveess
CCaammppbbeellll,,
JJrr..
Senator
RRiicchhaarrdd
MMiirraannddaa
Representative
RRiicchh
CCrraannddaallll
Senator
RReebbeeccccaa
RRiiooss
Representative
KKyyrrsstteenn
SSiinneemmaa
Senator
BBoobb
BBuurrnnss
(ex-officio) Representative
KKiirrkk
AAddaammss
(ex-officio)

DEBRA K. DAVENPORT, CP
A
AUDITOR GENERAL
STATE OF ARIZONA
OFFICE OF THE
AUDITOR GENERAL
WILLIAM THOMSON
DEPUTY AUDITOR GENERAL
2910 NORTH 44
th
STREET • SUITE 410 • PHOENIX, ARIZONA 85018 • (602) 553-0333 • FAX (602) 553-0051
March 11, 2009
Members of the Arizona Legislature
The Honorable Janice K. Brewer, Governor
Betsey Bayless, Chief Executive Officer
Maricopa Integrated Health System
Transmitted herewith is a report of the Auditor General, A Special Audit of the Maricopa
County Special Health Care District. This report is in response to Laws 2008, Chapter 288,
§22 and was conducted under the authority vested in the Auditor General by Arizona Revised
Statutes §41-1279.03. I am also transmitting with this report a copy of the Report Highlights
for this audit to provide a quick summary for your convenience.
As outlined in its response, the Maricopa County Special Health Care District agrees with
the findings and plans to implement all of the recommendations.
My staff and I will be pleased to discuss or clarify items in the report.
This report will be released to the public on March 12, 2009.
Sincerely,
Debbie Davenport
Auditor General
cc: Maricopa County Special Health Care District Board of Directors
Bill Bruno, Chairman Susan Gerard, Vice Chairman
Elbert Bicknell, Director Alice Lara, Director
Greg Patterson, Director
Attachment

The Office of the Auditor General has conducted a special audit of the Maricopa
County Special Health Care District (District), pursuant to Laws 2008, Chapter 288,
§22. This audit was conducted under the authority vested in the Auditor General by
Arizona Revised Statutes (A.R.S.) §41-1279.03.
In November 2003, Maricopa County voters approved the creation of a tax-levying
healthcare district; subsequently, voters approved a special healthcare district
governing board in the November 2004 election. On January 1, 2005, Maricopa
County, which was operating the healthcare system, transferred the system’s fiscal
and operational responsibilities to the new Maricopa County Special Health Care
District. The District consists of the District’s Board of Directors and an integrated
health system, which includes a teaching hospital, several other healthcare facilities,
and two health plans. In fiscal year 2008, the District had a total of over 400,000
inpatient admissions and outpatient visits.
As directed by the Legislature, this audit focuses on providing information in the
following areas of district operations:
The sources and uses of district funds, including amounts generated through
the District’s taxing authority (Chapter 1, pages 11 through 19).
The District’s financial condition and changes required to ensure financial
stability (Chapter 2, pages 21 through 31).
Management salaries (Chapter 3, pages 33 through 38).
Contract personnel and associated costs (Chapter 4, pages 39 through 48).
The amount of medical assistance provided to indigent individuals and policies
that have changed to restrict services to this population (Chapter 5, pages 49
through 53).
The amount of uncompensated care costs the District had annually in relation to
the amount provided before the District was formed and to the amounts other
hospitals in Arizona had (Chapter 6, pages 55 through 63).
Office of the Auditor General
SUMMARY
page i

Where applicable, the audit also makes recommendations for improvement.
District revenues (see pages 11 through 19)
The District receives revenue from various sources, and while the District’s revenue
increased about 34 percent from fiscal years 2006 to 2008, the proportion of each
revenue source remained relatively the same. In fiscal year 2008, more than 80
percent of the District’s total revenue of about $572 million continued to be from two
sources, patient service revenue and fixed monthly payments, known as capitation
payments, that it receives from the Arizona Health Care Cost Containment System
(AHCCCS), which administers the State’s Medicaid program.
In fiscal year 2008, after patient revenues and capitation payments, the next largest
sources of revenue were property taxes (8 percent) and federal and state assistance
(8 percent). When voters approved the District’s creation, they also gave the District
authority to impose a secondary property tax. In fiscal year 2008, the District received
over $46 million in property tax revenue—the maximum allowed without approval
from voters for an override of the statutory levy limit. Most of the federal and state
revenues are reimbursements for costs that the District has already incurred for
specific patient populations, such as a federal program that reimburses teaching
hospitals for a portion of the costs incurred for training residents.
Financial stability (see pages 21 through 31)
The District’s financial stability has improved, but its plans for a new hospital highlight
the need for it to take additional steps to ensure future stability. When the District
inherited the health system from Maricopa County, the system was facing a financial
crisis from large numbers of nonpaying patients, falling profitability, critically low cash
levels, and obsolete infrastructure. Various financial indicators, such as total net
assets almost doubling from June 2005 to June 2008, show that the District’s
financial condition has improved. In addition, auditors’ analysis of nine financial
indicators, such as “days cash on hand,” shows that the District has improved in
eight of the nine areas.
1
However, for four of the areas, the District is not yet meeting
its goals. Further, other measures of financial stability point to ongoing concerns—
the District reported that its financial condition is not yet strong enough to obtain an
investment-grade bond rating and has older facilities, and the District’s total
expenses related to bad debt and charity care are also increasing, which means that
more money is being spent on patients who cannot afford the full cost of their
medical services.
State of Arizona
page ii
1
“Days cash on hand” represents the number of days an entity could pay expenses if revenues were eliminated.

The District has taken preliminary steps to plan for a new hospital and has plans to
improve its clinics—actions that, if carried out, may require the District to borrow
substantially. Auditors identified several actions the District can take to help ensure
future financial stability, in addition to the various initiatives the District already has
underway. These actions include continuing strategic planning efforts and monitoring
financial and operational performance, explaining financing options to its Board of
Directors, and enhancing its process to analyze which projects should be funded.
Executive salaries (see pages 33 through 38)
When compared with similar healthcare facilities nationally, salaries for the District’s
top five executive management positions are generally lower than reported median
salaries. For example, when compared to all types of hospitals and health systems
with similar net revenues, the District’s Chief Executive Officer’s annual salary of
$367,600 was lower than the reported median salaries by at least $232,500, and the
Chief Medical Officer’s annual salary of $315,100 was lower than the reported
median salaries by at least $15,600.
The District’s executives also receive other forms of compensation, including district
contributions for benefits such as medical and dental insurance and the Arizona
State Retirement System (ASRS), paid time off, and merit pay. In addition, three
executives had district monies deposited into supplemental retirement accounts
because their salaries exceeded the ASRS maximum salary amount of $230,000 for
ASRS contributions.
1
However, they do not receive perks such as automobile
allowances.
Contracting practices for healthcare personnel (see
pages 39 through 48)
In fiscal year 2008, the District’s two largest contracts were for doctors and temporary
nurses. The District contracts with a private corporation that supplies all the doctors
and allied healthcare providers for its hospital and healthcare facilities.
2
Although this
structure is generally similar to the physician personnel structures at other teaching
hospitals, it is also unique in that the District contracts with a private entity, while other
teaching hospitals commonly contract with local university medical schools. The
contract contains cost containment and quality control features such as quality
performance contract incentives. However, this contract is a sole-source contract that
the District inherited from Maricopa County in 2005, and the District has not re-
evaluated the staffing model provided through the contract or determined whether a
Office of the Auditor General
page iii
1
As of December 2008, district counsel indicated that the District had no intention of making further contributions to this
supplemental retirement savings plan for these three employees, at least through June 30, 2012.
2
According to district policy, allied healthcare professionals include professionals such as physician assistants, nurse
practitioners, certified registered nurse anesthetists, and certified nurse midwives.

sole-source contract is still necessary. The District should re-examine whether this
staffing model is still optimal.
The District also contracts for some nursing personnel, but unlike its physician
positions, most of the District’s nursing staff are district employees. The District will
always need to supplement its nursing staff with contract nurses because of factors
such as a nation-wide nursing shortage; however, to help control costs, the District
has worked to increase its own nursing staff. For example, between fiscal year 2005
and October 2008, the average number of contracted nurses used each month has
dropped from 109 to 35, whereas the monthly average number of district nurses has
increased from 611 to 823 during this same period.
Medical services to indigents (see pages 49 through 53)
Since its inception, the District has had a program to serve indigent individuals who
are not eligible for other healthcare programs, such as the State’s Medicaid program
administered by AHCCCS. The District’s eligibility requirements and payment
policies have changed over time, but the program has always offered both
emergency and nonemergency services, such as outpatient surgeries and doctor’s
visits when a patient is ill. During fiscal year 2008, the program served approximately
39,540 individuals and had about $32 million in uncompensated medical services
costs.
1
According to the District, uncompensated medical services costs, often
referred to as charity care, are services provided to uninsured, low-income, and
underinsured patients who are financially unable to satisfy their debt. However, under
the District’s program, now called Copa Care, all participants, based on income
levels, are expected to pay some of the service costs. Although the program served
more individuals in fiscal year 2008 than in fiscal year 2007, its uncompensated
medical services costs decreased by about $7.5 million. According to the District, the
reduction resulted from increased patient revenue and decreased operating costs.
Uncompensated care costs (see pages 55 through 63)
In fiscal year 2008, the District had approximately $87 million in uncompensated care
costs—that is, costs incurred in providing care to people the District does not expect
to receive payment from.
2
The federal government’s Medicaid Disproportionate
Share Hospital (DSH) Payments program reimburses states for a portion of these
costs. The DSH program not only provides support for uncompensated care, but
also helps hospitals deal with low Medicaid reimbursement rates that are frequently
less than hospitals’ costs. AHCCCS, the State’s Medicaid agency, administers this
State of Arizona
page iv
1
These uncompensated medical services costs are for the District’s charity care program only, and do not represent the
District’s total uncompensated care costs, which were approximately $87 million in fiscal year 2008 (see Chapter 6, pages
55 through 63).
2
This report does not include uncompensated care costs for public hospitals in other states as requested in the legislation
because auditors determined that states may have different methods for calculating uncompensated care costs, and
thus it is not reasonable to compare these costs from state to state.

program, which involves determining which hospitals qualify based on established
criteria, and then distributing to these hospitals the DSH monies the Legislature
appropriates.
In fiscal year 2008, Arizona received nearly $94 million in federal DSH monies.
AHCCCS distributed the monies as follows: approximately $4.2 million went to the
District, approximately $17.3 million went to the private hospitals, and approximately
$72 million was deposited in the State General Fund. In addition, AHCCCS
distributed approximately $9 million from the State General Fund to the private
hospitals, which is the required state match, and according to AHCCCS resulted in
a net deposit to the State General Fund of approximately $63 million of federal DSH
monies. The District believes it should receive a larger portion of the State’s DSH
funds because, as the State’s primary safety net hospital, it has the largest amount
of uncompensated care costs, which must be certified to draw down some of the
federal DSH monies.
Office of the Auditor General
page v

State of Arizona
page vi

Office of the Auditor General
TABLE OF CONTENTS
continued
page vii
Introduction & Background
1
Chapter 1: District revenues
11
Net patient service revenue
11
Capitation
14
Property tax
14
Federal and state assistance
15
County assistance
18
Chapter 2: Financial stability
21
District has shown signs of improved financial stability
21
District’s plans for capital projects highlight need for continued improvement
26
Improving financial stability involves maintaining current initiatives and
adding new ones
28
Recommendations
31
Chapter 3: Executive salaries
33
District executives’ salaries generally lower than counterparts’ nationally
33
Total compensation packages include standard benefits but not perks
35
District executives’ salaries less than those offered to contractors before
and after District’s inception
37
Chapter 4: Contracting practices for healthcare personnel
39
District contracts for some personnel services
39
MedPro contract contains quality-of-care and cost containment
requirements
41
District should re-evaluate its model for obtaining physician services
45
District uses contract nurses on limited basis
46
Recommendation
48
Office of the Auditor General

State of Arizona
TABLE OF CONTENTS
continued
page viii
Chapter 5: Medical services to indigents
49
Eligibility and program fees have changed over time
49
Program costs and population served
52
Chapter 6: Uncompensated care costs
55
Federal government helps states cover uncompensated care costs
55
AHCCCS administers Arizona’s DSH program
56
Arizona’s uncompensated care costs and DSH payment distributions
59
District believes it should receive more DSH money
62
Appendix A: Salary survey analysis methodology and
additional salary information
a-i
Appendix B: Methodology
b-i
Appendix C: Bibliography
c-i
Agency Response

Office of the Auditor General
TABLE OF CONTENTS
continued
page ix
Tables:
1 Statement of Net Assets
As of June 30, 2005, 2006, 2007, and 2008
(Unaudited)
7
2 Statement of Revenues, Expenses, and Changes in Net Assets
Fiscal Years 2005 through 2008
(Unaudited)
8
3 Schedule of Net Patient Service Revenue
Fiscal Years 2005 through 2008
(Unaudited)
12
4 Schedule of Federal and State Assistance
Fiscal Years 2005 through 2008
(Unaudited)
16
5 Schedule of Maricopa County Assistance
Fiscal Years 2005 through 2008
(Unaudited)
18
6 Profitability Ratios Compared to District Goals
Fiscal Years 2006 through 2008
(Unaudited)
23
7 Liquidity Ratios Compared to District Goals
Fiscal Years 2006 through 2008
(Unaudited)
24
8 Debt Ratios Compared to District Goals
Fiscal Years 2006 through 2008
(Unaudited)
25
9 Salary Comparison Tables
As of December 2008
(Unaudited)
34

State of Arizona
TABLE OF CONTENTS
continued
page x
Tables:
10 Comparison of Annual Contracted County and District
Executive Salaries to December 2008 District Salaries
(Unaudited)
38
11 MedPro Contract Services Quality Control Incentives
As of January 2009
44
12 Comparison of the Average Monthly
Number of District Nurses to Contracted Nurses
Fiscal Years 2005 through 2009
47
13 Charity Care Patients, Revenues, and Costs
Fiscal Years 2007 and 2008
(Unaudited)
52
14 Charity Care Program Patient Demographics
Fiscal Year 2008
(Unaudted)
53
15 Arizona Hospitals’ Uncompensated Care Costs Claimed and
Related DSH Reimbursements and Distributions
Fiscal Years 2008
(Unaudited)
58
16 Arizona Hospitals’ Uncompensated Care Costs and
Monies Received Related to DSH
Fiscal Years 2000 through 2007
(Unaudited)
60
16 Arizona Hospitals’ Uncompensated Care Costs and
Monies Received Related to DSH
Fiscal Years 2000 through 2007
(Unaudited)
(Concluded)
61
17 Additional Salary Comparison Information
As of December 2008
(Unaudited)
a-iv


State of Arizona
page xii

The Office of the Auditor General has conducted a special audit of the Maricopa
County Special Health Care District (District), pursuant to Laws 2008, Chapter 288,
§22. This audit was conducted under the authority vested in the Auditor General by
Arizona Revised Statutes (A.R.S.) §41-1279.03.
As directed by the Legislature, this audit focuses on providing information in the
following areas of district operations:
The sources and uses of district funds, including amounts generated through
the District’s taxing authority (Chapter 1, pages 11 through 19).
The District’s financial condition and changes required to ensure financial
stability (Chapter 2, pages 21 through 31).
Management salaries (Chapter 3, pages 33 through 38).
Contract personnel and associated costs (Chapter 4, pages 39 through 48).
The amount of medical assistance provided to indigent individuals and policies
that have changed to restrict services to this population (Chapter 5, pages 49
through 53).
The amount of uncompensated care provided by the District annually in relation
to the amount provided before the District was formed and to the amount
reported by other hospitals in Arizona (Chapter 6, pages 55 through 63).
Where applicable, the audit also makes recommendations for improvement.
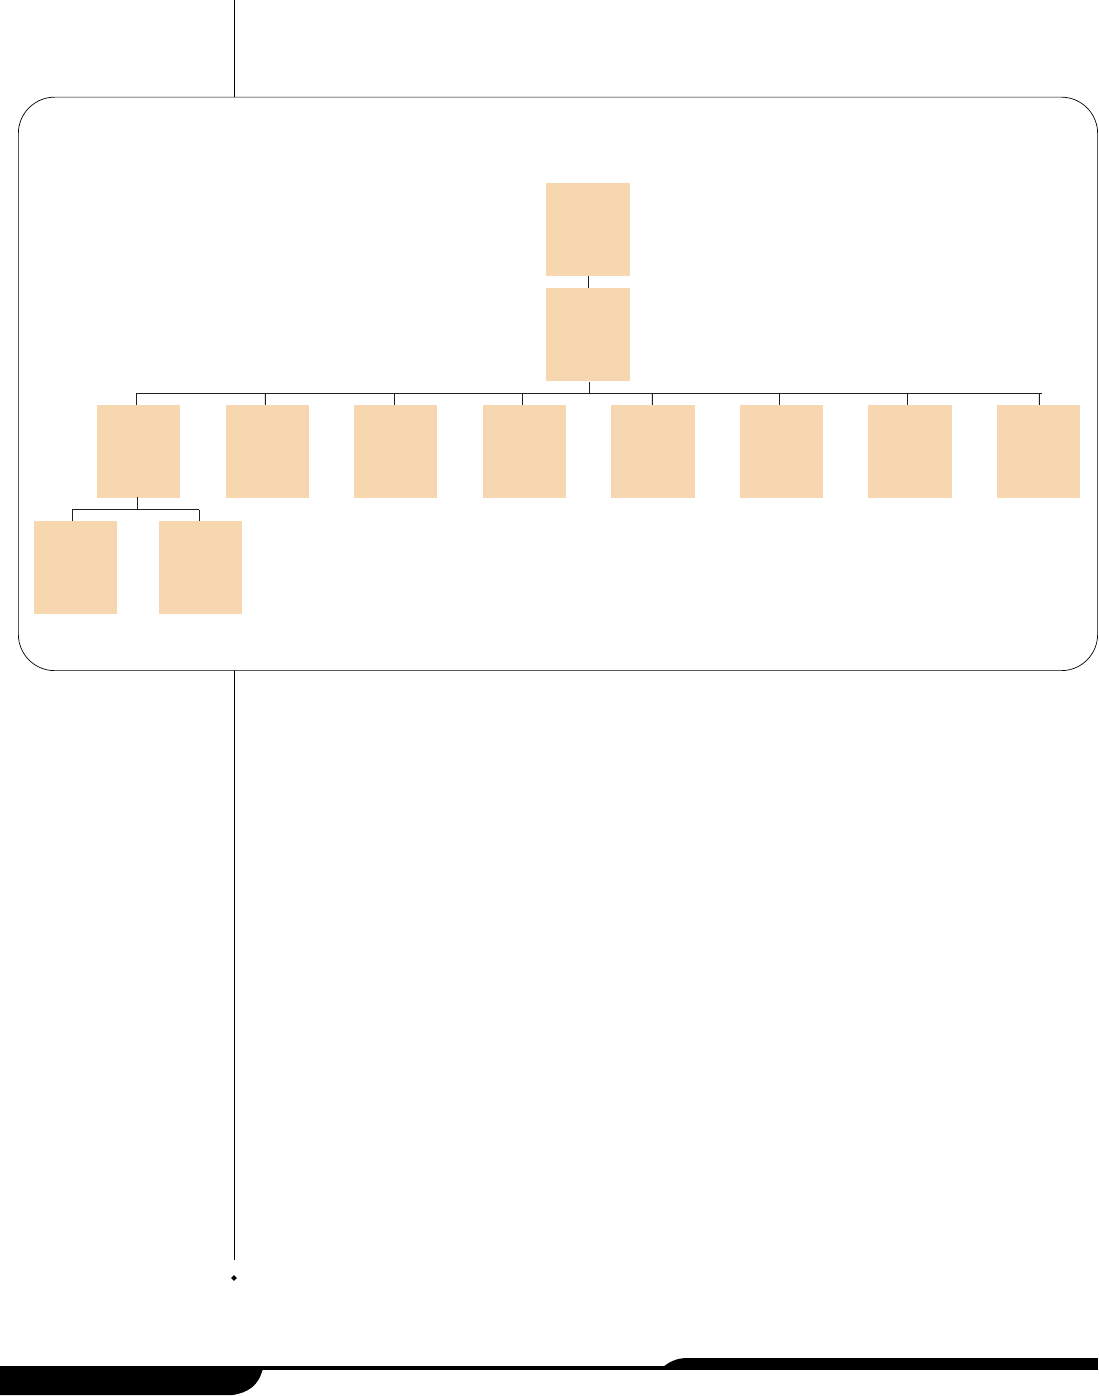
District history and system components
The Maricopa County Special Health Care District, as shown in Figure 1 (see page
2), consists of the District’s Board of Directors and an integrated health system, that
includes a hospital, several other healthcare facilities, and two health plans. In
November 2003, Maricopa County voters approved the creation of a tax-levying
healthcare district; subsequently, voters approved a special healthcare district
Office of the Auditor General
INTRODUCTION
& BACKGROUND
page 1
governing board in the November 2004 election. On January 1, 2005, Maricopa
County, which was operating the healthcare system, transferred the fiscal and
operational responsibilities for the system to the new District.
Maricopa County Special Health Care District Board of Directors
(Board)—The Maricopa County Special Health Care District is governed by a
five-member board of directors who are elected by Maricopa County voters and
serve 4-year terms. The Board’s responsibilities include appointing the District’s
Chief Executive Officer, monitoring the integrity of the District’s financial
statements, preparing budgets and capital plans, and reviewing and approving all
plans related to the healthcare of uninsured and underinsured patients. It also
reviews recommendations from the District’s Medical Staff Executive Committee
regarding appointment and reappointment of the District’s medical, dental, and
other healthcare staff.
Maricopa Integrated Health System (System)—The System consists of a
hospital, several other healthcare facilities, and two health plans. According to
district information, in fiscal year 2008, the System had over 21,000 inpatient
admissions and over 380,000 outpatient visits. Many of these visits were made by
patients who are eligible for the Arizona Health Care Cost Containment System
(AHCCCS), which is the State’s Medicaid program. In addition, in fiscal year 2008,
over 39,500 patients eligible for the District’s charity care program, now called
Copa Care, accounted for 90,371, or over 22 percent, of total visits. The Copa Care
program provides emergency and nonemergency healthcare to medically
underserved individuals who do not qualify for other healthcare programs (see
Chapter 5, pages 49 through 53, for additional information).
State of Arizona
page 2
District Board of
Directors
Maricopa
Integrated Health
System
Maricopa
Medical Center
Behavioral
Health
Psychiatric
Centers
(2 centers)
Comprehensive
Healthcare
Center
Family Health
Centers
(11 centers)
Urgent Care
Center
Complete
Comfort Care
Maricopa
Health Plan
Maricopa Care
Advantage Plan
Arizona Burn
Center
Arizona
Children’s
Center
Source: Auditor General staff analysis of district Web site facility description documents and health plan contract as of December 2008.
Figure 1: Organizational Chart
As of December 2008

Specifically, the System operates under one hospital license for 717 beds and is
composed of:
MMaarriiccooppaa
MMeeddiiccaall
CCeenntteerr——
The Medical Center is a full-service teaching
hospital with more than 440 beds. The District’s hospital is an accredited
teaching facility where the physicians who treat patients also teach the over
200 residents in training who are employed to work at the District’s hospital
and other centers, such as the Arizona Burn Center (see sub-bullet below).
1
The hospital includes an adult and pediatric emergency care center, a
newborn intensive care unit, and the Arizona Children’s Center (see sub-bullet
below). In addition, the hospital provides healthcare to inmates from federal,
state, county, and tribal correctional institutions. According to the District, in
fiscal year 2008 it provided inpatient and outpatient care to 8,565 inmate
patients.
•
AArriizzoonnaa
BBuurrnn
CCeenntteerr——
The Burn Center, which is located within the
Medical Center, is a facility with more than 40 beds that is designated as
a regional burn center and provides inpatient and outpatient care for
burns and skin diseases. According to district information, in fiscal year
2008, it provided care to 763 patients admitted to its facility and 6,462
patients on an outpatient basis.
•
AArriizzoonnaa CChhiillddrreenn‘‘ss CCeenntteerr——
The Children’s Center, which is located within
the Medical Center, operates the 24-hour Pediatric Emergency
Department, a 12-bed Pediatric Intensive Care Unit that supplies inpatient
services for infants, children, and adolescents, and a 40-bed Neonatal
Intensive Care Unit that provides critical inpatient services for babies born
in the hospital as well as babies transported from across the Southwest.
According to the District, in fiscal year 2008, the Pediatric Emergency
Department provided care to nearly 17,000 patients.
BBeehhaavviioorraall hheeaalltthh ppssyycchhiiaattrriicc cceenntteerrss——
The District operates two behavioral
health psychiatric centers licensed for a total of 190 inpatient beds. According
to district information, in fiscal year 2008, the District treated 2,520 patients
admitted to its behavioral health psychiatric facilities. Inpatient services
include chemical dependency treatment, psychological testing, group and
family therapy, and medication education. According to district information, it
also provided outpatient care to 2,575 patients at its Desert Vista Behavioral
Health Center. Outpatient services include psychiatric evaluations, individual
and family therapy, and prescription of medication, if necessary.
CCoommpprreehheennssiivvee
HHeeaalltthhccaarree
CCeenntteerr——
The Healthcare Center provides primary
care for children and adults, including specialty services such as cardio-
pulmonary, dental, ear-nose-and-throat, internal medicine, dialysis, oncology,
orthopedics, ophthalmology, pediatrics, pharmacy, radiology, vascular
surgery, and women’s health services.
Office of the Auditor General
page 3
1
The Medical Center is accredited by the Accreditation Council for Graduate Medical Education, which is a private,
nonprofit council that evaluates and accredits medical residency programs in the United States.

CCoommmmuunniittyy-bbaasseedd
ffaammiillyy
hheeaalltthh
cceenntteerrss——
The District’s 11 community-based
family health centers provide primary care services for adults and children. In
fiscal year 2008, the health centers provided services to over 152,000 patients.
Some health centers also provide dental and pharmacy services. One of the
centers specializes in human immunodeficiency virus (HIV) related medical care
for adults.
UUrrggeenntt CCaarree CCeenntteerr——
The System opened an Urgent Care Center in 2007 to
meet the needs of the residents who had relied on the former Phoenix Memorial
Hospital for urgent care services. Located in the Emergency Department on the
former Phoenix Memorial campus at 7th Avenue and Buckeye Road, the center,
according to the District, served over 18,000 patients in fiscal year 2008.
CCoommpplleettee CCoommffoorrtt CCaarree——
This program provides attendant care to elderly or
disabled clients in their homes. Services are tailored to individual needs and can
include cooking and cleaning, personal patient care, and companionship.
According to the District, in fiscal year 2008, over 952,000 hours of care were
provided to patients served through this program.
The System also contains two health plans:
MMaarriiccooppaa
HHeeaalltthh
PPllaann——
The Maricopa Health Plan (Plan) is one of six health
plans operating for Maricopa County residents that AHCCCS contracts with. The
Plan was in operation for nearly 20 years before the District was formed. Prior to
October 2005, Maricopa County operated the Plan. Starting in October 2005,
the District contracted with Tucson-based University Physicians Health Plans, a
division of University Physicians Healthcare, to manage the Plan. According to
the District, as of December 2008 the Plan had over 50,000 members.
1
According to district information, the Plan offers its members complete
healthcare services, including a choice of doctors, dentists, the Medical Center,
the District’s Family Health Centers, pharmacies, and emergency care in
Maricopa County.
MMaarriiccooppaa
CCaarree
AAddvvaannttaaggee——
This health plan (Plan) which began January 1,
2008, provides access to similar services as the Maricopa Health Plan. However,
this Plan is for a targeted special needs patient population of Medicare-eligible
patients who have greater needs because of their severe or chronic health
conditions. According to the District, this Plan had over 700 members as of
December 2008. University Physicians Healthcare and the District partnered in
a 50/50 joint venture to start the Maricopa Care Advantage Plan in order to
secure a Medicare Advantage Special Needs Program contract with the Centers
for Medicare and Medicaid Services. The District and University Physicians
Healthcare shared in startup costs. Maricopa Care Advantage is overseen by a
Board of Directors consisting of two members from the District and two
members from University Physicians Healthcare. It is managed by the same
State of Arizona
page 4
1
University Physicians Healthcare is a nonprofit corporation supporting the faculty doctors at the University of Arizona
College of Medicine. University Physicians Health Plans is a division of University Physicians Healthcare.

company that manages the District’s other health plan, University Physicians
Health Plans, a division of University Physicians Healthcare.
Accreditation
The District is accredited by a national healthcare accreditation organization. In
December 2008, the District received full accreditation from the Joint Commission, a
not-for-profit organization that evaluates and accredits healthcare programs in the
United States. This followed an earlier, September 2007 decision by the Joint
Commission to give the District a conditional accreditation, which means the
organization is not in substantial compliance with the Joint Commission’s standards
and it must remedy the identified problem areas. The Joint Commission identified 17
such areas during its 2007 accreditation review. According to a district official it found
that the District had remedied all 17 areas in the December 2008 review. For
example, the Joint Commission found that the District needed to ensure it has a
complete and accurate medical record for all patients served. The District has
addressed this by providing training and auditing records for accuracy.
Organization and staffing
The District has a five-member executive management team consisting of Chief
Executive, Financial, Operating, and Medical Officers, and a Senior Vice President
and Chief External Affairs Officer.
1,2
These positions are involved in directing,
controlling, evaluating, and developing organizational operations and resources to
ensure quality healthcare. District staff is composed of both permanent and
contracted employees. The District reported that it had an average of 3,630
permanent district employees per month in fiscal year 2008, including more than 800
nurses.
Although most staff are permanent employees, the District contracts for all of its
physicians and allied healthcare providers, along with some of its nurses. The District
contracts with a private corporation, Medical Professional Associates of Arizona
(MedPro), for all of its physician and allied healthcare provider services.
3
MedPro was
created in 1994 by physicians already employed by the Maricopa County Hospital
(for more information about MedPro, see Chapter 4, pages 39 through 48). Although
MedPro staff are subject to district board approval, MedPro is responsible for
providing the District’s physicians (medical doctors and doctors of osteopathy), and
many other credentialed healthcare professionals. As of January 2009, according to
The District contracts for
all of its physicians with
a private corporation,
MedPro.
Office of the Auditor General
page 5
1
The District’s Chief Medical Officer retired in February 2008 and as of December 2008, this position remained vacant.
2
Prior to December 2008, this position’s title was Vice-President Internal Development.
3
According to district policy, allied healthcare professionals include professionals such as physician assistants, nurse
practitioners, certified registered nurse anesthetists, and certified nurse midwives.

State of Arizona
page 6
MedPro, the District was contracting with them for the services of 205 physicians and
75 other healthcare providers. In addition, although the District has decreased the
number of temporary nurses it contracts out for by hiring more nurses permanently
(see Chapter 4, pages 39 through 48) from July through October 2008, the District
contracted for an average of 35 nurses per month.
Assets and revenue
The District’s assets have increased since it began operation on January 1, 2005. As
illustrated in Table 1 (see page 7), its assets have grown from $116.4 million at the
end of fiscal year 2005 to $262.6 million at the end of fiscal year 2008. As shown in
Table 2 (see page 8), in fiscal year 2005, some of the District’s assets consisted of
Maricopa County contributions. Specifically, Maricopa County contributed $6.3
million in cash and $62.8 million in other assets to the District in fiscal year 2005. Of
the $62.8 million in other assets, $32.8 million was capital assets, appraised at fair
market value on January 1, 2005, including property and equipment. However,
according to a district official, Maricopa County did not contribute the main hospital,
the Comprehensive Health Center, and one of the behavioral health psychiatric
centers to the District. The District pays Maricopa County an annual amount of $12
for leasing the main hospital and the behavioral health center, and $1.4 million for
leasing the Comprehensive Health Center, because Maricopa County has a long-
term debt obligation on this property.
Further, as shown in Table 2 (see page 8), the District receives revenue from various
sources and its revenue has also increased over time. In fiscal year 2008, the District
had operating revenue of more than $500 million. Sources of operating revenue
result from providing services through its normal operations and primarily consist of
patient revenue. The District also receives nonoperating revenue. Nonoperating
revenue is money derived from other sources, such as property taxes, grants, or
investments. For example, in fiscal year 2008, the District received over $46 million
from the property tax levy that was established when the District was formed, and
more than $7 million in state and federal grants.
Audit scope and objectives
As set forth in Laws 2008, Chapter 288, §22, audit work focused on six areas within
the District, and this report includes six chapters and recommendations as
appropriate, covering the areas in legislation. Specifically:
The Auditor General shall conduct a financial and performance audit of the
Maricopa Special Health Care District, which includes the Maricopa Integrated
In 3 years, district
assets have increased
by more than $140
million.

Office of the Auditor General
page 7
2005 2006 2007 2008
A
ssets
Current assets:
Cash and cash equivalents $ 7,972,267 $ 52,830,802 $ 4,305,003 $ 1,081,903
Short-term investments 60,258,608 69,991,227
Patient accounts receivable, net of allowances
1
61,035,690 50,339,440 44,448,598 52,376,462
AHCCCS medical education receivable 2,893,945 28,466,815
Health plans receivable 6,135,431 15,964,742 21,623,212
Other receivables 4,666,291 11,489,302 11,629,058 8,564,740
Supplies 6,168,973 4,882,944 4,961,198 5,498,031
Prepaid expenses 851,387 1,389,050 1,726,713 1,799,127
Estimated amounts due from third-party payors 440,000 1,138,020
Due from related parties 134,726
297,909 2,343,670 1,387,309
Total current assets
81,269,334
128,502,898
148,531,535
190,788,826
Long-term investments 14,564,020 2,070,750
Capital assets:
Land 4,090,000 4,090,000 4,090,000 4,090,000
Depreciable capital assets, net of accumulated
depreciation 30,676,580
40,352,728 56,999,346 67,141,497
Total capital assets, net of accumulated
depreciation 34,766,580 44,442,728 61,089,346 71,231,497
Other assets 373,912
4,330,997 1,584,815 612,874
Total assets $116,409,826
$191,840,643 $213,276,446 $262,633,197
Liabilities and net assets
Current liabilities:
Accounts payable $ 13,248,550 $ 21,935,749 $ 25,420,987 $ 24,059,017
Accrued payroll and employee benefits 12,058,797 12,036,622 14,766,906 17,915,732
Medical claims payable 17,350,990 20,167,480 20,569,645
Overpayments due to third-party payors 8,591,358 6,140,854 5,366,057 7,761,404
Other current liabilities 1,683,813 8,743,487 12,780,031 16,581,914
Current maturities of long-term debt and capital
leases 1,133,098
2,460,318 3,734,453 10,326,879
Total current liabilities 36,715,616 68,668,020 82,235,914 97,214,591
Long-term debt 7,821,144
30,726,575 33,390,390 24,642,537
Total liabilities 44,536,760
99,394,595 115,626,304 121,857,128
Net assets:
Invested in capital assets, net of related debt 27,733,755 63,477,195 41,898,763 49,655,337
Restricted for grants 290,665 712,178 459,687
Unrestricted 44,139,311
28,678,188 55,039,201 90,661,045
Total net assets 71,873,066
92,446,048 97,650,142 140,776,069
Total liabilities and net assets $116,409,826
$191,840,643 $213,276,446 $262,633,197
Table 1: Statement of Net Assets
As of June 30, 2005, 2006, 2007, and 2008
(Unaudited)
1
Patient accounts receivable balances were reported net of allowances for uncollectible accounts totaling $38,643,601 for 2005, $40,688,387 for
2006, $33,843,156 for 2007, and $40,999,432 for 2008.
Source: Auditor General staff analysis of the District’s audited financial statements and general ledgers for the 6-month period ended June 30, 2005,
and for fiscal years 2006 through 2008.

State of Arizona
page 8
2005
(6 months)
2006
2007
2008
Operating revenues:
Gross patient charges $417,135,447 $916,214,931 $1,110,290,697 $1,316,074,738
Less:
Internal transactions 108,519,701 130,451,738 145,604,380
Contractual adjustments 223,729,268 463,030,829 531,822,429 657,394,894
Charity care program 122,915,022 127,832,108
Bad debts 38,643,601
84,620,871 41,975,974 52,692,740
Net patient service revenue 154,762,578 260,043,530 283,125,534 332,550,616
Capitation 92,781,362 126,222,832 137,852,101
Other 5,539,544
19,880,749 25,383,389 40,925,469
Total operating revenues 160,302,122
372,705,641 434,731,755 511,328,186
Operating expenses:
Salaries and wages 69,618,101 145,476,202 165,654,356 194,842,815
Employee benefits 19,453,107 38,352,094 48,563,229 57,830,631
Purchased services 34,366,198 84,176,981 104,232,496 89,520,955
Medical claims 53,029,187 80,039,020 85,581,930
Supplies and other expenses 34,436,663 75,682,521 78,439,045 90,102,741
Depreciation 3,483,495
7,790,123 7,954,860 9,287,490
Total operating expenses
161,357,564
404,507,108
484,883,006
527,166,562
Operating loss (1,055,442
) (31,801,467) (50,151,251) (15,838,376)
Nonoperating revenues (expenses):
Property taxes 40,000,000 43,000,000 46,310,880
Noncapital grants 2,747,004 5,234,777 6,518,509 7,293,209
Noncapital subsidies from Maricopa County 1,773,948 3,547,900 3,547,896 3,547,896
Other nonoperating revenues 1,618,771 4,078,089 1,806,582 1,151,966
Investment income 256,013 1,717,452 2,988,257 2,890,090
Interest on debt (580,211
) (2,203,769) (2,505,899) (2,229,738)
Total nonoperating revenues 5,815,525
52,374,449 55,355,345 58,964,303
Income before contributions 4,760,083 20,572,982 5,204,094 43,125,927
Contributions from Maricopa County
2
:
Cash contributions 6,336,001
Other assets
3
62,838,753
Increase in net assets 73,934,837 20,572,982 5,204,094 43,125,927
Net assets, beginning of year (2,061,771)
71,873,066 92,446,048 97,650,142
Net assets, end of year $ 71,873,066
$ 92,446,048 $ 97,650,142 $ 140,776,069
Table 2: Statement of Revenues, Expenses, and Changes in Net Assets
Fiscal Years 2005 through 2008
1
(Unaudited)
1
The District began operations on January 1, 2005, and therefore, fiscal year 2005 amounts represent activity for only 6 months.
2
Maricopa County transferred the assets of its Maricopa Integrated Health System to the newly created Special Health Care District on January 1,
2005.
3
Consists of patient and other accounts receivable, supplies, prepaid expenses, and property and equipment.
Source: Auditor General staff analysis of the District’s audited financial statements and general ledgers for the 6-month period ended June 30, 2005,
and for fiscal years 2006 through 2008.

Health System, pursuant to section §41-1278, Arizona Revised Statutes, and
provide a report to the Governor, the President of the Senate, and the Speaker
of the House of Representatives on or before March 15, 2009. The audit shall:
1. Identify and examine the current financial, administrative, and operational
issues of the District and identify changes required to ensure financial
stability (see Chapter 2, pages 21 through 31).
2. Identify the amount of funds generated through the taxing authority of the
District and how such funds are used (see Chapter 1, pages 11 through 19).
3. Examine the personnel structure, specifically management salaries,
contract personnel, and associated costs, and evaluate whether this
structure is consistent with and necessary for the execution of the statutorily
designated duties of the District (see Chapter 3 for executive management
salaries, pages 33 through 38, and Chapter 4 for contract personnel, pages
39 through 48).
4. Identify all sources of state and federal funding received by the District and
how these funds are used (see Chapter 1, pages 11 through 19).
5. Examine and identify the amount of medical assistance furnished to
indigent individuals who are uninsured and ineligible for Medicaid and other
health service programs and identify policies that have changed to restrict
services to this population (see Chapter 5, pages 49 through 53).
6. Examine the amount of uncompensated care provided on an annual basis
by the District and measure this amount in relation to the amount of
uncompensated care provided by facilities of the District before the
formation of the District, to the amount of uncompensated care provided by
facilities of the District before the implementation of Proposition 204, and to
the amount of uncompensated care reported by other private hospitals in
Arizona and public hospitals in other states (see Chapter 6, pages 55
through 63).
7. Recommend programmatic, administrative, financial, and operational
changes to ensure financial stability, improved accessibility, and effective
healthcare delivery (see recommendations, Chapter 2, page 31, and
Chapter 4, page 48).
The Auditor General and staff express appreciation to the District’s Board of
Directors, Chief Executive Officer, and staff for their cooperation and assistance
throughout the audit.
Office of the Auditor General
page 9
State of Arizona
page 10

District Revenues
The Maricopa County Special Health Care District (District) receives
revenues from various sources, including patient service revenue, the
District’s property tax, and federal assistance. From fiscal years 2006 to
2008, district revenues increased by about 34 percent, but during that
time, the percentage of revenue from each source remained relatively
consistent. Each year, more than 80 percent of district revenues primarily
came from two sources—patient service revenue and fixed monthly
payments (known as capitation)—received from the Arizona Health Care Cost
Containment System (AHCCCS), Arizona’s Medicaid agency.
1
Although a district
official indicated that all of the District’s revenues can be used for its operation, most
of the federal and state revenues are reimbursements for costs the District has
already incurred for specific patient populations.
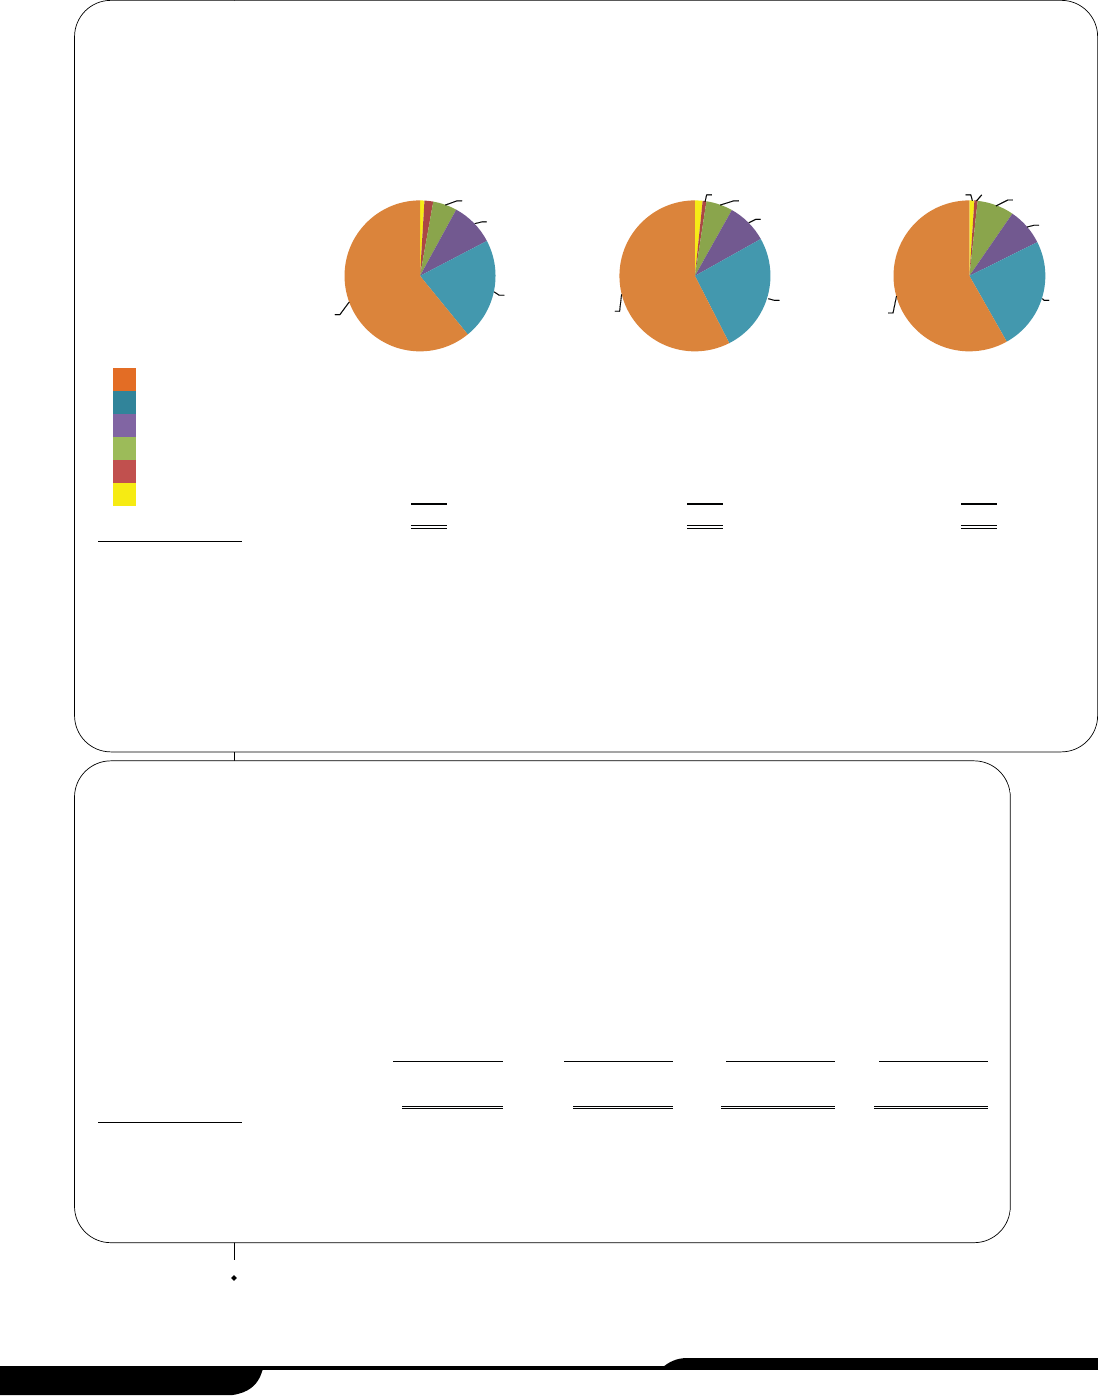
Figure 2 (see page 12) provides an overview of the revenues by source. The sections
that follow explain the five largest sources in further detail, including the amount the
District has received each year, the reasons for changes in the amounts over time,
and estimates of the amounts available for fiscal year 2009, if available. The Office of
the Auditor General is making no recommendations about the matters discussed in
this chapter.
Net patient service revenue
Net patient service revenue is total gross patient charges less various transactions
that reduce the amount of patient revenue received (see descriptions, page 13). As
shown in Table 3 (see page 12), it has increased from $260 million in fiscal year 2006
to $332.6 million in fiscal year 2008, an increase of about $72.6 million, or almost 28
percent, during that time period. According to a district official and budget
documents, the increase resulted from a higher service volume in clinic and urgent
care visits and outpatient services, and a slight rate increase on the AHCCCS and
Medicare accounts. The District expects net patient service revenue to increase by
more than 6 percent in fiscal year 2009.
Office of the Auditor General
page 11
CHAPTER 1
1
Patient service revenue is received from patients, and patients’ insurers such as Medicare, Workers’ Compensation, and
private insurance companies.
Legislative Item
The audit shall identify the
amount of funds generated
through the taxing authority of
the District and how such funds
are used; and identify all sources
of state and federal funding
received by the District and how
these funds are used.
State of Arizona
page 12
2005
(6 months)
2006 2007 2008
Gross patient charges $417,135,447 $916,214,931 $1,110,290,697 $1,316,074,738
Less:
Internal transactions 108,519,701 130,451,738 145,604,380
Contractual adjustments 223,729,268 463,030,829 531,822,429 657,394,894
Charity care program 122,915,022 127,832,108
Bad debts 38,643,601
84,620,871 41,975,974 52,692,740
Net patient service revenue $154,762,578
$260,043,530 $ 283,125,534 $ 332,550,616
Table 3: Schedule of Net Patient Service Revenue
Fiscal Years 2005 through 2008
1
(Unaudited)
1
Maricopa County transferred the system’s fiscal and operational responsibilities to the District on January 1, 2005, and therefore,
fiscal year 2005 amounts represent activity for only 6 months.
Source: Auditor General staff analysis of the District’s audited financial statements and general ledgers for the 6-month period ended June
30, 2005, and for fiscal years 2006 through 2008.
1%
1%
6%
9%
26%
57%
1%
1%
8%
8%
24%
58%
1%
2%
5%
9%
22%
61%
Figure 2: Revenues by Source
1
Fiscal Years 2006 through 2008
2
(In Millions)
(Unaudited)
1
Each revenue source is described on pages 11 through 19.
2
Maricopa County transferred the Maricopa Integrated Health Care System’s (system) fiscal and operational responsibilities to the District on
January 1, 2005, and therefore, fiscal year 2005 amounts represent activity for only 6 months. Therefore, fiscal year 2005 amounts are not
presented here because the data is not comparable to the 12-month data presented.
3
Amount consists of investment income, food sales, rental income, insurance proceeds for damaged property, and other miscellaneous sources.
Source: Auditor General staff analysis of the District’s audited financial statements and general ledgers for fiscal years 2006 through 2008.
Net patient service
$260
$283
$333
Capitation
93
126
138
Property tax 40 43
46
Federal and state assistance 22 28
45
County assistance 8 4
4
Other
3
4
8
6
$427
$492
$572
2006 2007 2008

Office of the Auditor General
page 13
Specifically, net patient service revenue is derived from the following components:
GGrroossss
ppaattiieenntt
cchhaarrggeess——
These charges represent the amount charged to
patients who received inpatient, outpatient, behavioral health, and other medical
services from the District’s hospital and health clinics.
IInntteerrnnaall
ttrraannssaaccttiioonnss——
These transactions are revenue amounts that must be
subtracted so that they are not counted twice. For example, the District operates
one of AHCCCS’ health plans and receives a monthly capitated amount as
revenue for every person enrolled. When an individual covered by this health
plan receives services from the District’s hospital, the revenue is also recorded
for the hospital, but it is then later subtracted to eliminate an internal transaction
since both the hospital and the health plan are part of the District. For fiscal years
2006 through 2008, the amount of these transactions was about 11 to 12 percent
of the total gross patient charges.
CCoonnttrraaccttuuaall aaddjjuussttmmeennttss——
These adjustments are discounts granted to
healthcare insurance organizations and government agencies based on agreed-
upon contract rates that are below the gross patient charges.
1
For fiscal years
2006 through 2008, the amount of these adjustments was about 48 to 51
percent of the total gross patient charges.
CChhaarriittyy ccaarree pprrooggrraamm——
This program, now called Copa Care, was created to
serve uninsured or underinsured patients who are ineligible for other programs
such as the State’s Medicaid program, administered by AHCCCS. Programs like
these are often called charity care programs because services are offered for
free or at a discounted rate. The District has established discounted fees for the
Copa Care program based on patients’ family size and income (see Chapter 5,
pages 49 through 53, for additional information). The discounts granted to this
patient population are deducted from gross patient charges. For fiscal years
2007 and 2008, these discounts amounted to about 10 to 11 percent of the total
gross patient charges. Although the District had a charity care program in fiscal
years 2005 and 2006, all of the discounts under the program at that time were
written off as bad debt (see next bullet).
BBaadd
ddeebbttss——
These deductions consist of medical services the District provided
and expected to receive payments for but did not. This happens when patients
are unable or unwilling to pay their bills. Also, patients’ insurance carriers dispute
their bills for many reasons such as service coverage, billing timeliness, and
patient eligibility. According to a district official, the District has an unwritten bad
debt policy that writes off certain accounts after they are 120 or 150 days past
due; however, the District continues to seek collection of the debts.
2
The total
bad debt amount was over 9 percent of the total gross patient charges in fiscal
1
Healthcare organizations and government agencies include AHCCCS, Medicare, private insurance companies, law
enforcement agencies, and workers’ compensation.
2
According to a district official, self-pay, Maricopa County Correctional Health, private insurer, lien, law enforcement, and
AHCCCS pending accounts are written off after 120 days past due. AHCCCS grievance, private managed care, Medicare
Special Needs, and Workers’ Compensation accounts are written off after 150 days past due.

year 2006. It decreased to 4 percent in fiscal years 2007 and 2008, when the Copa
Care program was implemented. However, for fiscal year 2009, a district official
indicated that the bad debt amount will increase by more than $7 million because
the District increased its gross patient charges.
Capitation
Capitation revenue is a fixed monthly advance payment that the District receives for
providing a full range of healthcare services, such as inpatient and outpatient services,
to AHCCCS and Medicare special needs members.
1
This revenue is restricted to
paying for medical costs incurred by AHCCCS and Medicare special needs members
and any allowable administrative costs. As shown in the textbox,
capitation revenue was $137.9 million in fiscal year 2008, an
increase of approximately $45 million, or nearly 49 percent, since
fiscal year 2006. According to a district official, the increase is
attributable to the fact that the District began the AHCCCS health
plan operation in October 2005 and therefore received capitation
revenue for only 9 months in fiscal year 2006. Since then the
AHCCCS health plan has had nearly an 18 percent rate increase.
In addition, during the second half of fiscal year 2008, the District
began a new health plan for Medicare special needs patients (see
Introduction and Background, pages 1 through 10, for additional
information) and received almost $1.3 million in capitation revenue for this plan.
According to district budget documents, the District expects increases in both
AHCCCS and Medicare capitation for fiscal year 2009.
Property tax
When Maricopa County voters approved the creation of the Special Health Care
District in the November 2003 election, the approval included authority to impose a
secondary property tax. Statute stipulated that for the first year the tax was authorized
and levied, it must not exceed an amount equal to $40 million, the maximum tax levy
limit for the base year.
2
Each subsequent year, the District’s levy amount can be
adjusted from its prior year’s levy amount based on a percentage equal to the rate of
change in the County’s levy limit between the current and prior years. The Maricopa
County Assessor calculates the rate of change and the District’s allowable levy limit for
each fiscal year. If the District wants to increase its property tax revenue beyond the
levy limit, voters must approve a tax levy limit override to increase the maximum
State of Arizona
page 14
1
Under the Medicare Prescription Drug Improvement and Modernization Act of 2003, Congress created a new type of
Medicare Advantage coordinated care plan focused on individuals with special needs. Special needs plans were allowed
to target enrollment to one or more types of special needs individuals identified by Congress as: (1) institutionalized; (2)
dually eligible; and/or (3) individuals with severe or disabling chronic conditions.
2
A.R.S. §48-5565.
Capitation
Fiscal Years 2006 through 2008
(Unaudited)
Source: Auditor General staff analysis of the District’s audited financial
statements and general ledgers for fiscal years 2006 through
2008.
2006 2007 2008
$92,781,362 $126,222,832 $137,852,101

Office of the Auditor General
page 15
allowable levy. For fiscal years 2006 through 2008, the District received the maximum
amount of its property tax revenue.
1
The District’s property tax revenue can be used to pay for
any operating costs, including maintaining and operating
the District’s facilities, payments for professional and other
services, and debt service, including principal and interest
on any bonds issued. As shown in the textbox, property tax
revenue was $46.3 million in fiscal year 2008, an increase of
over $6.3 million, or nearly 16 percent, since fiscal year
2006. Although tax rates have declined since 2006, the
District’s property tax revenue has increased because of
higher assessed property values in Maricopa County. The
District’s levy amount for fiscal year 2009 is approximately $49.9 million, a 7.8 percent
increase from fiscal year 2008, which was the maximum allowable levy limit
calculated by the County Assessor.
Federal and state assistance
As shown in Table 4 (see page 16), federal and state assistance revenues have
increased from $22.3 million in fiscal year 2006 to $45 million in fiscal year 2008, an
increase of about $22.7 million or about 102 percent, during that time period.
2
Most
of these revenues are reimbursements provided to cover the costs of services for
various state or federal programs described below. Specifically:
GGrraadduuaattee
MMeeddiiccaall
EEdduuccaattiioonn
((GGMMEE))——
This federal program, which requires a
state match, recognizes that teaching hospitals incur significant costs, such as
residents’ salaries, employee benefits, and training costs, in addition to the costs
associated with patient care. AHCCCS is responsible for allocating the federal
and state matching monies annually among the Arizona hospitals according to
statutory and administrative code requirements.
3
The District’s GME revenue has increased by approximately $13.2 million, or 144
percent, since fiscal year 2006. According to a district official, its payment has
significantly increased because AHCCCS allocated monies to compensate for
its uncompensated indirect program costs incurred for training the residents in
fiscal year 2008.
4
Prior to fiscal year 2008, the District received allocations only
for uncompensated direct program costs for training the residents. According to
1
Maricopa County transferred the system’s fiscal and operational responsibilities to the District on January 1, 2005. The
District’s first property tax was levied in August 2005 in accordance with Arizona Revised Statutes §§42-17151 and 48-
5563.
2
In Table 4 (see page 16), the sum of the “other” category represents less than 1 percent of the District’s total revenues.
Thus, auditors do not describe it in this chapter.
3
Arizona Administrative Code, Title 9, Chapter 22, Article 7.
4
The GME program recognizes that a hospital may experience a marginal increase in its operating costs. Therefore, the
federal government has established a formula for calculating an indirect cost amount that is based on a hospital’s
residents-to-beds ratio and a congressionally approved rate.
Property Tax
Fiscal Years 2006 through 2008
(Unaudited)
Source: Auditor General staff analysis of the District’s audited financial
statements and general ledgers for fiscal years 2006 through
2008.
2006 2007 2008
$40,000,000 $43,000,000 $46,310,880

a district official, in fiscal year 2009, the District expects to receive approximately
the same GME amount as in fiscal year 2008.
MMeeddiiccaaiidd
DDiisspprrooppoorrttiioonnaattee
SShhaarree
HHoossppiittaall
((DDSSHH))
PPaayymmeennttss——
Under this
program, the federal government reimburses states for a portion of the medical
services costs that their hospitals incur when providing care to people they do
not expect to receive payment from. Such costs are known as uncompensated
care costs (see Chapter 6, pages 55 through 63, for additional information).
AHCCCS is responsible for allocating these monies annually to the State and
qualifying Arizona hospitals. The District has received approximately $4.2 million
in DSH monies each fiscal year since its inception. In January 2009, the
Legislature eliminated the District’s share of DSH monies for fiscal year 2009.
1
FFeeddeerraallllyy
QQuuaalliiffiieedd
HHeeaalltthh
CCeenntteerrss
((FFQQHHCC))——
This federal program, which
requires state matching monies, provides the District with additional payments
when AHCCCS members obtain services at district community centers that
have been certified as federally qualified healthcare center look-alikes.
2
According to the District, it pursued the FQHC designation as an important step
in allowing the District to expand services throughout the community and was
awarded this designation in 2006. AHCCCS is required to reimburse the District
State of Arizona
page 16
1
Laws 2009, 1st S.S., Ch. 4, §7.
2
A federally qualified health center (FQHC) is a type of provider defined by the Medicare and Medicaid statutes. FQHCs
include all organizations receiving grants under Section 330 of the Public Health Service (PHS) Act, certain tribal
organizations, and FQHC Look-Alikes. An FQHC Look-Alike is an organization that meets all of the eligibility requirements
of an organization that receives a PHS Section 330 grant, but does not receive grant funding.
2005
(6 months)
2006 2007
2008
Graduate medical education $ 9,177,507 $10,528,218
$22,394,965
Medicaid disproportionate share
hospital payments $2,101,144 4,202,300 4,202,300
4,202,300
Federally qualified health
centers 1,290,675 3,625,649
7,364,685
Ryan White grants 1,471,282 2,980,845 3,178,687
3,524,278
Arizona primary care program 1,035,401 1,804,010 2,473,706
2,668,146
Trauma and emergency services 896,833 2,377,933 3,000,441
3,630,129
Other
2
237,996 449,922 1,403,316
1,262,192
Total federal and state
assistance $5,742,656
$22,283,192 $28,412,317
$45,046,695
Table 4: Schedule of Federal and State Assistance
Fiscal Years 2005 through 2008
1
(Unaudited)
1
Maricopa County transferred the system’s fiscal and operational responsibilities to the District on January 1, 2005, and therefore,
fiscal year 2005 amounts represent activity for only 6 months.
2
Consists of tobacco use prevention, hospital preparedness-bioterrorism, health academy, transportation-related injury prevention,
newborn intensive care, and other program revenues.
Source: Auditor General staff analysis of the District’s audited financial statements and general ledgers for the 6-month period ended
June 30, 2005, and for fiscal years 2006 through 2008.

Office of the Auditor General
page 17
quarterly for the difference between the FQHC rate and the AHCCCS rate for the
Medicaid patients who visited the District’s community health centers. The
District began receiving the FQHC reimbursements from AHCCCS in March
2006.
The District’s share of FQHC revenue has increased by $6.1 million, or nearly
471 percent, since fiscal year 2006. According to district budget documents and
AHCCCS staff, the increase resulted from about a 20 percent in increase in clinic
visits and a nearly 43 percent FQHC rate increase since March 2006. The District
received a significant rate increase in October 2007 because AHCCCS adjusts
the FQHC rate every third federal fiscal year. For fiscal year 2009, AHCCCS
expects to reimburse the District approximately $7 million.
RRyyaann WWhhiittee GGrraannttss——
The Ryan White Human Immunodeficiency Virus or
Acquired Immune Deficiency Syndrome (HIV/AIDS) grants are for programs that
provide HIV-related health services. These federal grant monies are to be used
for those who do not have sufficient healthcare coverage or financial resources
for coping with HIV. The District annually applies for these federal grants, which
must be used to provide outpatient services including primary care, dental,
mental health, and substance abuse services for HIV patients. The annual
contract award amount is based on the amount budgeted at the federal level for
these grants.
The District’s Ryan White grants have increased by over $500,000, or
approximately 18 percent, since fiscal year 2006. According to the District, the
primary reason for the increase is that more federal funding was available in
fiscal years 2007 and 2008. According to district budget documents, for fiscal
year 2009, the District expects the Ryan White grants to increase by nearly 1
percent.
AArriizzoonnaa
PPrriimmaarryy
CCaarree
PPrrooggrraamm——
This program offers comprehensive primary
care and preventive dental services to uninsured residents of Arizona whose
family income is below 200 percent of the federal poverty guidelines and who
are not eligible for Medicare or AHCCCS. This program is funded by the State
General Fund and tobacco tax monies. Using a competitive bidding process,
the Arizona Department of Health Services awarded a contract to the District that
began in July 2005 with options to renew each year for a maximum of 4 years.
The annual contract award amount is based on the amount budgeted at the
state level for this program. The District submits expenditure and other data
monthly to the Arizona Department of Health Services for reimbursement.
The District’s revenue for this program has increased by almost $900,000, or
nearly 48 percent, since fiscal year 2006. According to a district official, the
primary reason for the increase is that the State budgeted more funding for this
program in fiscal years 2007 and 2008. For fiscal year 2009, the Department of
Health Services renewed its contract with the District for $2.8 million, almost a 5
percent increase from fiscal year 2008.

TTrraauummaa
aanndd
EEmmeerrggeennccyy
SSeerrvviicceess
—These revenues, which come from a portion
of Indian gaming revenues, help to cover a portion of the unrecovered trauma
and emergency services costs incurred by qualified trauma centers in the
State.
1
The District’s hospital is one of seven trauma centers in Arizona.
According to administrative code requirements, AHCCCS is responsible for
allocating these monies biannually among the State’s trauma centers based on
the reported number of trauma cases and the related unrecovered trauma and
emergency costs.
2
The District’s share of the trauma and emergency services payment has
increased by about $1.3 million, or nearly 53 percent, since fiscal year 2006.
According to district budget documents, the increase is attributable to better
reporting of eligible expenses to AHCCCS. The District expects its fiscal year
2009 revenue from this source to remain nearly the same as fiscal year 2008.
County assistance
As shown in Table 5, the District has received assistance from Maricopa County since
fiscal year 2005. These revenues subsidize the District’s psychiatric residency
teaching program and stabilize the District’s financial position during the transition
period.
State of Arizona
page 18
2005
(6 months)
2006
2007
2008
Psychiatric residency teaching program $1,773,948 $3,547,900 $3,547,896 $3,547,896
Assistance package 1,618,771
4,446,768 767,976 817,126
Total county assistance $3,392,719
$7,994,668 $4,315,872 $4,365,022
Table 5: Schedule of Maricopa County Assistance
Fiscal Years 2005 through 2008
1
(Unaudited)
1
Maricopa County transferred the system’s fiscal and operational responsibilities to the District on January 1, 2005,
and therefore, fiscal year 2005 amounts represent activity for only 6 months.
Source: Auditor General staff analysis of the District’s audited financial statements and general ledgers for the 6-month
period ended June 30, 2005, and for fiscal years 2006 through 2008.
1
During the November 2002 election, voters approved Proposition 202, which allowed casinos to increase the numbers
of slot machines and gaming tables, such as blackjack, in exchange for the State’s receiving 1 to 8 percent of their
revenue. A portion of that revenue is used to fund the trauma and emergency services program.
2
Arizona Administrative Code, Title 9, Chapter 22, Article 21.

Office of the Auditor General
page 19
Specifically, these revenues subsidize the following:
PPssyycchhiiaattrriicc
RReessiiddeennccyy
TTeeaacchhiinngg
PPrrooggrraamm——
The 1989 Arizona Supreme Court
ruling in the Arnold v. Sarn case granted class action status to indigent seriously
mentally ill people and ruled that both the State and Maricopa County had failed
to provide adequate services and funding to this population in Maricopa
County.
1
According to Maricopa County, in 1993 the court monitor assigned to
assess compliance with the ruling determined that Maricopa County should
continue to provide at least the same level of service to class members through
the psychiatric residency teaching program as it provided in fiscal year 1993. As
a result, since the District’s inception, Maricopa County has provided
approximately $3.5 million each fiscal year for the District’s psychiatric residency
teaching program. For fiscal year 2009, according to Maricopa County budget
documents, the County budgeted the same amount for the program.
AAssssiissttaannccee
PPaacckkaaggee——
In June 2005, the District accepted the assistance
package offered by Maricopa County’s Board of Supervisors. According to this
package, it serves as a means to stabilize the District’s financial position. It
includes:
• Two waivers, one for approximately $1.6 million in election costs for the first
election that created the District, and one for $1.1 million in rental payments
for the Comprehensive Health Care Center.
• $2.6 million in cash assistance to pay for consulting services.
• Two loans—one for a $15 million line of credit and one for $443,000 in
election costs for the second election that created the District’s Board of
Directors. These 10-year loans are interest-free for the first 5 years.
The District recognized the election, consulting services, and rental assistance
as revenues in fiscal years 2005 and 2006. The waiver of interest expense is
being reported as revenue over the 5-year, interest-free period and will expire in
fiscal year 2011.
1
Arnold v. Sarn, 160 Ariz. 593, 775 P.2d 521 (1989).

State of Arizona
page 20

Financial stability
The Maricopa County Special Health Care District’s (District) financial
stability has generally improved, but the District’s plans for a new hospital
highlight the need for it to take additional steps to ensure future stability.
When the District inherited the Maricopa Integrated Health System
(System) from Maricopa County (County), the System’s financial condition was weak.
Various financial indicators show that the District’s financial condition has since
improved, though there are still reasons for concern. The District has taken
preliminary steps to plan for a new hospital and improve its clinics—actions that, if
carried out, may require the District to borrow substantially. Taking steps such as
developing strategies for modifying projects and limiting risks, as well as continuing
various financial stability initiatives already underway, will help the District as it
prepares to address its future needs.
District has shown signs of improved financial stability
Since the District took over the System’s operation from the County, the District has
shown signs of improved financial stability. Reports from the County indicate that the
System was facing a financial crisis before transitioning to the District in January
2005. Since then, the District’s audited financial statements and related financial
indicators have shown signs of improvement, such as total net assets almost
doubling from June 2005 to June 2008. However, other measures of financial stability
point to ongoing concerns—the District reported that its financial condition is not yet
strong enough to obtain an investment-grade bond rating, has significant bad debt
and charity care expenses, and has older facilities.
System in poor financial condition when transferred to District—Right
before its transition from the County to the District, the System was in poor financial
condition. According to a citizens’ task force established in 2003 by the County’s
Board of Supervisors and a 2004 financial condition report by the County’s Internal
Audit Department, the System was facing a financial crisis. Reasons for this crisis
Office of the Auditor General
page 21
CHAPTER 2
Legislative Item
The audit shall identify and
examine the District’s current
financial, administrative, and
operational issues and identify
changes required to ensure
financial stability.

included large numbers of nonpaying patients, falling profitability, critically low
cash levels, and obsolete infrastructure and capital investment needs at the main
hospital and clinics. In addition, the County subsidized the System’s hospital since
1994, including amounts ranging from $15.3 million to $66.2 million each year in
fiscal years 2000 through 2004.
District financial reports show improvement—The District’s audited
financial statements show improved financial stability since it took over the
System’s operations on January 1, 2005. The District’s total net assets (assets
minus liabilities) have almost doubled, from $71.9 million at June 30, 2005, to
$140.8 million at June 30, 2008 (see Introduction & Background, Table 1, page 7).
Much of this increase occurred during fiscal year 2008 when the District’s net
assets increased by over $43.1 million, which represents approximately 7.5
percent of its total revenues of $572 million (see Chapter 1, Figure 2, page 12).
Further, the District’s cash and short-term investments, which can quickly be
converted to cash, increased from about $8 million after the District’s first 6 months
of operation to about $71 million at the end of fiscal year 2008 (see Introduction &
Background, Table 1, page 7). Much of this cash increase—nearly $44.9 million—
occurred during fiscal year 2006 (see Introduction & Background, Table 1, page 7).
In all, the District improved its financial condition because of increased revenues
and improved operations. For example, the District has increased patient service
revenue (see Chapter 1, Table 3, page 12), which the District reports resulted from
higher patient service volume and a slight rate increase on the Arizona Health Care
Cost Containment System (AHCCCS) and Medicare accounts. The District’s other
revenues, such as federal and state assistance revenue, have also increased,
such as an additional $12 million in reimbursements that the District reports is for
indirect costs incurred for its graduate medical education program in fiscal year
2008 (see Chapter 1, Table 4, page 16). In addition, in fiscal year 2008, the District
reduced operating expenses by replacing contract nurses with full-time employees
(see Chapter 4, Table 12, page 47). However, progress was not steady throughout
the 3-year period. Between fiscal years 2006 and 2007, some of the financial
results worsened because eligibility was expanded for the District’s charity care
program, which serves indigent individuals and therefore has large amounts of
uncompensated medical services costs (see Chapter 5, pages 49 through 53).
District financial indicators show signs of improvement—Auditors’
evaluation of the District’s financial indicators (see textbox) also shows that the
District’s financial condition has improved since fiscal year 2006, but there is still
room for improvement.
1
The District tracks nine financial indicators, eight of which
are cited by literature as being among the most important indicators of a hospital’s
financial stability.
2
The nine indicators can be categorized into three groups:
profitability, liquidity, and debt ratios.
State of Arizona
page 22
FFiinnaanncciiaall
iinnddiiccaattoorrss
are
ratios calculated using
financial statement
amounts. These
indicators show an
entity’s financial
condition and are used to
establish its credit rating.
1
Fiscal year 2005 had only a 6-month operation period, and its financial indicators are not comparable to fiscal years 2006
through 2008. Therefore, they are not presented in Tables 6 through 8.
2
Berger, 2005; HFMA, 2007; Kaufman, 2006; Nowicki, 2004

Using the District’s audited financial statements, auditors calculated the indicators
for fiscal years 2006 through 2008 and compared them to the District’s goals,
which are median values of hospitals with a BBB bond rating by Standard & Poor’s
(S&P).
1
A BBB rating is the minimum rating the District would need for issuing
investment-grade bonds to finance capital projects. Attaining these BBB goals
would help fulfill the District’s initial long-range financial goal to become a
“creditworthy” organization by September 2011.
As shown in Tables 6 through 8 (see pages 23 through 25), the District improved
on eight of the nine indicators by fiscal year 2008, though for four of the indicators,
the results do not yet meet the District’s goals. In addition,
as discussed above, the District’s financial results
worsened in fiscal year 2007 because its charity care
program was expanded.
PPrrooffiittaabbiilliittyy
rraattiiooss——
As shown in Table 6, the District
showed improvement from fiscal year 2006 to 2008 in
all three profitability ratios it tracks. Profitability ratios
(see textbox) measure an entity’s ability to make a
profit, or excess of revenues over expenses. Literature
indicates that the operating margin ratio is one of the
most essential metrics.
2
The District’s operating
margin, while improving, remains below the District’s
goal, indicating a need for continued improvement.
Office of the Auditor General
page 23
1
A bond rating is a grade given to an organization that helps investors understand the relative risk involved with purchasing
bonds for that organization. S&P, a major bond-rating entity, provides the following investment-grade bond ratings: AAA,
AA, A, and BBB. The District does not yet have a bond rating.
2
Berger, 2005; HFMA, 2007
Ratio
2
2006 2007 2008
September
2011
District
Goal
Operating margin
(8.5)% (11.5)% (3.1)% 2.1%
Excess margin
4.8% 1.1% 7.5% 4.5%
EBIDA margin
7.2% 3.2% 9.5% 11.1%
Table 6: Profitability Ratios Compared to District Goals
1
Fiscal Years 2006 through 2008
(Unaudited)
1
District goals are median values of hospitals with a BBB bond rating, which is the
minimum rating needed to issue investment-grade bonds.
2
Lower negative or higher positive numbers are desirable.
Source: Auditor General staff analysis of the District’s audited financial statements for fiscal
years 2006 through 2008 and the District’s September 2008 Financial Indicators—
Consolidated report.
Profitability Ratios
OOppeerraattiinngg
mmaarrggiinn
is the percentage of operating
revenues that represents operating profit.
EExxcceessss
mmaarrggiinn
is similar to the operating
margin except it includes nonoperating
revenues, such as the property tax monies and
grants, and overall profit.
EEaarrnniinnggss
BBeeffoorree
IInntteerreesstt,,
DDeepprreecciiaattiioonn,,
aanndd
AAmmoorrttiizzaattiioonn
((EEBBIIDDAA))
is the same ratio as
excess mar
gin except it excludes expenses
from interest, depreciation, and amor
tization.

LLiiqquuiiddiittyy
rraattiiooss——
As illustrated in Table 7, three of the four
liquidity ratios that the District tracks improved from fiscal
year 2006 to 2008. Liquidity ratios (see textbox) measure an
entity’s ability to pay its obligations as they come due.
Literature says that the days cash on hand indicator is the
most important indicator of credit position in the not-for-profit
healthcare market and that higher cash balances tend to
correlate with higher credit ratings.
1
In addition, literature
states that most hospital analysts believe that the days in net
patient accounts receivable metric is critical to proper
financial management functioning.
2
The days of cash on
hand, while slightly improved, remains well below the
District’s goal. The improvement in days in net patient
accounts receivable has been greater, with the District’s
2008 figure relatively close to its goal. Of the four liquidity
indicators, only the cushion ratio failed to improve; however,
the District continues to exceed its goal for this ratio.
State of Arizona
page 24
1
Berger, 2005; HFMA, 2007; Kaufman, 2006
2
Berger, 2005
Ratio
2006 2007 2008
September
2011
District
Goal
Days cash on hand
2
48.6 49.4 50.1 124.4
Days in net patient
accounts receivable
3
70.7 57.3 57.5 52.3
Cushion ratio
2
13.3 12.0 12.7 8.4
Unrestricted cash to
long-term debt ratio
2
171.9% 193.4% 288.4% 81.9%
Table 7: Liquidity Ratios Compared to District Goals
1
Fiscal Years 2006 through 2008
(Unaudited)
1
District goals are median values of hospitals with a BBB bond rating, which is the minimum rating
needed to issue investment-grade bonds.
2
Higher numbers are desirable.
3
Lower numbers are desirable.
Source: Auditor General staff analysis of the District’s audited financial statements for fiscal years
2006 through 2008 and the District’s September 2008 Financial Indicators—Consolidated
report.
Liquidity Ratios
DDaayyss
ccaasshh
oonn
hhaanndd
represents the number of
days an entity could pay expenses if revenues
were eliminated.
DDaayyss
iinn
nneett
ppaattiieenntt
aaccccoouunnttss
rreecceeiivvaabbllee
measures the average number of days that
patient accounts are due before they are
collected.
CCuusshhiioonn
rraattiioo
compares the relationship
between available cash and total debt service
(payments made on principal and interest
amounts).
UUnnrreessttrriicctteedd ccaasshh ttoo lloonngg-tteerrmm ddeebbtt
r
epresents
the availability of an organization’s liquidity to
pay off existing long-term debt. This is the only
ratio not identified by literatur
e as being one of
the most important ratios.

DDeebbtt
rraattiiooss——
As shown in Table 8, from fiscal years
2006 to 2008, the District improved in both debt ratios
it tracks. Debt ratios (see textbox) measure an entity’s
ability to cover debt and take on additional debt. In
both cases, the District’s fiscal year 2008 ratios are
better than its goals, but this may reflect the fact that
the District has not borrowed any money to construct
or purchase buildings since its inception. If the District
follows through on its plans for a new hospital and
changes to its network of clinics, this situation may
change considerably.
Other stability measures suggest continued reason for concern—
Despite the District’s improvement, concerns remain. A report by the Healthcare
Financial Management Association (HFMA) lists financial warning signs of
financially distressed hospitals, and the District has a few of these signs.
1
For
example, the average age of its facilities is greater than 10 years (see page 26 for
more information). In addition, the District’s total expenses related to bad debt and
its charity care program (see Chapter 1, Table 3, page 12) are increasing, which
means that more money is being spent on patients who cannot afford the full cost
of their medical services.
District officials also reported that the District’s financial condition is not yet strong
enough to obtain investment-grade bonds. As previously indicated, the District has
not met four of its nine ratio goals, which provide guidance on performance
needed to obtain an investment grade bond rating. Along this line, another HFMA
Office of the Auditor General
page 25
1
HFMA, 2006a
Ratio
2006 2007 2008
September
2011
District
Goal
Debt service coverage
2
7.7 2.9 9.7
3.1
Long-term debt to capitalization
3
51.7% 37.8% 21.4%
42.8%
Table 8: Debt Ratios Compared to District Goals
1
Fiscal Years 2006 through 2008
(Unaudited)
1
District goals are median values of hospitals with a BBB bond rating, which is the minimum rating
needed to issue investment-grade bonds.
2
Higher numbers are desirable.
3
Lower numbers are desirable.
Source: Auditor General staff analysis of the District’s audited financial statements for fiscal years
2006 through 2008 and the District’s September 2008 Financial Indicators—Consolidated
report.
Debt Ratios
DDeebbtt
sseerrvviiccee
ccoovveerraaggee
measures the hospital’s
ability to repay its long-term debt and
represents overall profit adjusted for
depreciation and interest, divided by debt
payments.
LLoonngg-tteerrmm
ddeebbtt
ttoo
ccaappiittaalliizzaattiioonn
indicates the
level of long-term debt that the entity is
carrying compared to its net assets that are not
dedicated for a specific use.

report has a method to determine a hospital’s ability to borrow money.
1
A hospital
with a high ability to borrow money is described as being able to fund its own
capital needs or considered as an excellent credit risk to the capital markets. A
hospital with a limited ability to borrow money is described as being under
significant financial strain and having access to capital from only a limited number
of sources and at a higher cost than hospitals with stronger financial performance.
Using the HFMA’s method, auditors determined that the District is somewhere in
between or has a moderate ability to borrow money because it still has room for
financial improvement.
District’s plans for capital projects highlight need for
continued improvement
Although the District has improved its financial stability, plans for new capital projects
highlight the need to make even more improvements. The District is planning for
three major capital projects: constructing a new main hospital, improving its clinics,
and improving and integrating its business process and technology. These projects,
particularly the new hospital, could add hundreds of millions of dollars to the District’s
financial obligations. Such projects may require the District to borrow substantial
sums of money—something the District has not done yet.
District plans to build new main hospital and improve clinics—District
officials reported that a new main hospital and improved clinics are needed based
on consultant reports, changes to building codes since the facilities were
constructed, and the District’s impact on the community. Specifically:
FFaacciilliittiieess
iinn
ppoooorr
ccoonnddiittiioonn——
According to two 2006 consultant reports, the
main hospital and many of the clinics are in poor but serviceable condition.
One of the consultants, Health Management Associates, stated that the
District should construct new facilities so that its main campus and its
neighborhood clinic system can remain viable.
2
In addition, this report stated
that the facilities on the main campus and the clinic sites, most of which were
constructed between 1970 and 1996, suffer from underfunded and poorly
executed maintenance. For example, this report listed the facilities’ functional
and physical concerns, such as a lack of storage space, and roof and
plumbing/HVAC piping systems leaks in many facilities reviewed. These leaks
caused mold growth, which reportedly led to about $1.8 million in annual
abatement costs. The other consultant, 3D/International, reported that the
hospital’s major systems, such as plumbing, cooling, and electrical, were
nearing the end of their useful lives and have high replacement costs.
3
The
District reported that it had spent approximately $22 million from January 1,
2005, to the end of fiscal year 2008, to repair and maintain its facilities.
State of Arizona
page 26
1
HFMA, 2006b
2
Health Management Associates, 2006
3
3/D International, 2006

RReennoovvaattiioonnss
mmaayy
rreedduuccee
hhoossppiittaall
ccaappaacciittyy——
Building codes and standards
have changed since the facilities were built, and the District believes this adds
to the need for a new main hospital. Although not required to follow newer
building codes and standards unless required by the Arizona Department of
Health Services (DHS), district officials are concerned that the main hospital,
built in 1970, has an outdated design. For example, it has four-bed patient
rooms instead of the new construction minimum standard of one-bed rooms.
Similarly, the adult intensive care units have six to nine beds, some of which
are not aligned with current standards, such as space at each bedside for
visitors and a window in each patient bed area. An official from the DHS
reported that it would require the District to come into compliance with building
codes for new construction if the hospital undergoes substantial renovations.
District officials estimate that converting four-bed patient rooms into single-
bed rooms and complying with other requirements in the codes would reduce
the bed size in the main hospital by at least one-third, from more than 440
licensed beds to 300. According to the District, renovations would cost about
the same as new construction costs and also result in lost revenues while
floors were shut down for renovations. As noted previously, several of the
hospital’s major systems are nearing the end of their useful lives and a major
problem in one of these systems could trigger the need for renovations. The
District thinks that renovations would have a severe negative impact on the
community and its operations if areas were shut down and if the bed size were
reduced.
IImmppoorrttaannccee
ttoo
tthhee
ccoommmmuunniittyy——
Further, district officials reported that if they do
not build a new hospital and system failures in their current hospital are large
enough, the District will need to permanently close its doors, which would
result in many patients being displaced to other hospitals and some patients
not receiving healthcare. The District is a significant provider of
uncompensated care in the State (see Chapter 6, pages 55 through 63);
provides important behavioral health services; offers inpatient and outpatient
care to federal, state, county, and tribal inmate populations; and has the
region’s only burn center. In addition, officials stated that a new hospital would
result in increases in operational and efficiency savings.
The District has taken preliminary steps to plan for a new main hospital and
improve its clinics. District officials met with architects in 2007 to start preliminary
planning for a new main hospital and expect to resume planning activity during
fiscal year 2010. The District estimates that the new hospital would take 4 to 5
years to build at an estimated cost of between $400 million and $600 million. The
District also plans to reconfigure its clinics. Specifically, a district official stated that
the District is analyzing if it has the right number of clinics, if they are in the right
locations, and if they are offering the right services. The District’s strategic plan
includes developing a facility financing plan by June 2009, reconfiguring its clinics
by 2012, and constructing a new main hospital by 2014.
Office of the Auditor General
page 27

District has started project to improve and integrate its business
process and technology—Another major project, referred to as the ARK
project, was initiated to improve and integrate the District’s business process and
technology, and includes making medical records available in an electronic format.
District officials reported that this project will provide a new, enterprise-wide system
to replace and enhance clinical and financial systems to better support the
healthcare delivery process. Anticipated benefits include enhanced patient safety,
quality of care, regulatory compliance, operational efficiencies, and employee
satisfaction. For example, electronic records can help eliminate unavailable,
misplaced, or overlooked information, which may lead to decisions based on a
clinician’s memory, and instead provide automated alerts and searchable
information, which may lead to more consistent care. According to the District, the
ARK project will also help AHCCCS with its efforts to implement a state-wide online
electronic health records system. District officials stated that implementation of the
ARK project in their existing hospital will be transferrable to a new hospital and will
not result in any lost effort.
The ARK project is divided into three phases, which would take place through 2017
at an estimated cost of $83 million. In August 2008, the Maricopa County Special
Health Care District Board of Directors (Board) approved the first phase, which is
designed to provide a full electronic medical record system by 2013 at an
estimated cost of $32.8 million. The District has not borrowed any money to
implement this project and plans to pay for all phases with cash.
Improving financial stability involves maintaining current
initiatives and adding new ones
The District should continue and expand its efforts to improve its financial condition.
These efforts are important both because the District still has room for improvement
and faces additional challenges if it carries out plans to build a new hospital and
improve its existing clinics. Literature provides a framework for hospital financial
management that includes strategic and financial planning, deciding how to pay for
projects, analyzing and selecting potential projects, and monitoring progress.
1
Although the District’s financial management practices are generally in line with these
recommended practices, the District should continue and enhance its current efforts.
Specifically, four areas need continued attention: overall strategic planning,
identifying ways to pay for capital projects, enhancing its process to analyze which
capital projects should be funded, and monitoring financial and operational
performance.
SSttrraatteeggiicc aanndd ffiinnaanncciiaall ppllaannnniinngg——
The District should continue its strategic and
financial planning efforts. The District developed an organization-wide strategic
plan that was approved by the Board in August 2008. The plan includes
State of Arizona
page 28
1
HFMA, 2005a; Kaufman, 2006

reconfiguring its clinics by 2012 and building a new hospital by 2014. Financial
planning includes such things as identifying ways for building cash and debt
capacity, and analyzing creditworthiness. For example, in line with
recommended practices, the District analyzes the profitability of its service lines,
and officials reported that this practice has helped them negotiate payer
agreements and conduct further analyses resulting in efforts to maximize
reimbursements. It also has begun to assess its creditworthiness, which
according to literature is critical to the success of future strategic and financial
planning, by comparing its monthly progress on nine financial indicators as
discussed above. The District should continue its strategic and financial
planning efforts, which include analyzing its profitability and creditworthiness.
PPaayyiinngg
ffoorr
ccaappiittaall
pprroojjeeccttss——
The District should continue its efforts to identify and
plan for ways to pay for its capital projects. Capital projects are typically long-
term projects requiring large sums of money to develop, improve, or maintain
assets that generate income. Literature indicates that no healthcare organization
can fund its long-term growth strategy solely from reserves and operating cash
flow.
1
The District believes its long-term growth requires a new hospital and
improvements to its clinics, and as of December 2008, the District was still
considering how it will pay for these capital projects. According to Arizona
Revised Statutes §48-5541.01, the District may borrow and invest monies,
create debt, assume debt, and refinance debt. The District is also evaluating
other options such as lease-to-own arrangements, and the District expects to
present a financing plan to its Board by June 2009. To help the Board decide
how to pay for capital projects, the District should ensure that this financing plan
includes an explanation of the costs and terms of different financing options and
how these options will support the District’s competitive position and financial
performance. This is especially important because the District may have
challenges obtaining debt under reasonable terms and paying it off.
AAnnaallyyzziinngg
aanndd
sseelleeccttiinngg
ccaappiittaall
pprroojjeeccttss——
Once the District knows how much
money it has available and can borrow for capital projects, it should
enhance its process to analyze which projects should be funded.
According to literature, some key elements of this process include
creating a solid business plan (see textbox) for each capital
investment project and projecting cash flows in a net present value
(NPV) analysis. Among other things, an NPV analysis determines a
project’s dollar value and estimates future cash flow amounts.
Although district managers have used business plans and projected
cash flows for some projects, they can take additional steps to
improve. Specifically:
•
AAdddd
ssttrraatteeggiieess
ttoo
mmooddiiffyy
pprroojjeeccttss
aanndd
lliimmiitt
rriisskkss——
The District made
business plans for its project to create electronic medical records and
other capital projects. However
, the District’s business plans lacked a
Office of the Auditor General
page 29
The District should
explain the costs and
terms of different
financing options to its
Board of Directors.
1
Kaufman, 2006; Nowicki, 2004
A
bbuussiinneessss ppllaann
describes a
capital project and specifies
why it is needed and how it
will be implemented. The plan
should include other elements,
such as a strategy to modify or
terminate the project.
The District plans to
build a new main
hospital by 2014.

strategy to modify projects and limit risks if warning signs arose. The
District needs to add such strategies to its business plans, including
plans that will be made for building a new hospital, improving its clinics,
and all other capital investment projects.
•
IInncclluuddee
pprroojjeecctteedd
ccaasshh
fflloowwss
ffoorr
ccaappiittaall
pprroojjeeccttss
oovveerr
aa
tthhrreesshhoolldd
aammoouunntt——
As of December 2008, the District had projected future cash
flows, including revenues and expenses, for a few capital projects. In
addition, the District’s strategic plan includes steps that will likely require
more capital projects. Even if these projects do not generate revenue,
cash flows can be projected by estimating how the projects will save
money. For example, the District’s Finance Department projected three
types of cost savings for a project involving leased laundering equipment.
Literature suggests that organizations determine a threshold, such as
$500,000, that dictates when it will conduct more detailed financial
analyses.
1
The threshold is applied to capital investment projects that are
strategically driven and not to routine replacement items such as roofing
repairs. The District should determine a threshold amount and project
cash flows for all potential strategically driven capital projects over that
amount.
•
CCoonndduucctt
NNPPVV
aannaallyysseess——
As of November 2008, the District’s capital
allocation committee had not yet conducted an NPV analysis to help
select which capital projects to pursue. To help prioritize its capital
projects and strategic initiatives, this committee should use the projected
cash flows to conduct NPV analyses.
MMoonniittoorriinngg
ppeerrffoorrmmaannccee——
The District should continue its efforts to monitor its
financial and operational performance. In addition to tracking the nine financial
indicators mentioned above, the District uses daily, weekly, and monthly
reporting mechanisms to monitor its financial condition. For example, one of the
District’s monthly reports shows whether the cost of salaries, supplies, and other
operating expenses in eight operating areas varied from budgeted amounts.
According to a district official, senior management reviews this report and meets
each month to discuss variances from budgeted amounts to hold each other
accountable for the results and to discuss ways in which the operating areas
can help each other. In addition, the District prepares monthly reports with
graphs of numerous operational indicators such as a count of the number of
patient visits, patients’ lengths of stay, and the number of employees per patient
for presentation to the Board. For example, the District’s operational indicators
showed that in fiscal years 2007 and 2008, the number of inpatients remained
relatively stable and the number of outpatients increased.
State of Arizona
page 30
The District has various
mechanisms to monitor
financial and operational
performance.
1
Kaufman, 2006

Recommendations:
2.1. To help ensure financial stability, the District should continue and expand its
efforts to improve its financial condition by:
a. continuing its strategic and financial planning efforts, which include
analyzing its profitability and creditworthiness;
b. ensuring its financing plan due to the Board in June 2009 includes an
explanation of the costs and terms of different financing options and how
these options will support the District’s competitive position and financial
performance;
c. enhancing its process to analyze which capital projects should be funded
by adding strategies to its business plans to modify projects and limit risks
if warning signs arise, by determining a threshold amount and projecting
cash flows for all potential strategically driven capital projects over that
amount, and by ensuring the capital allocation committee uses the
projected cash flows to conduct net present value analyses; and
d. continuing its efforts to monitor its financial and operational performance.
Office of the Auditor General
page 31

State of Arizona
page 32

Executive salaries
When compared to salaries in national healthcare surveys, the Maricopa
County Special Health Care District’s (District) executive management
salaries generally are lower. These executives also receive benefits such
as healthcare and retirement benefits, but their total compensation
packages do not include perks, such as automobile allowances. Their
salaries, as of December 2008, were also lower than salaries paid to the
contractors who held these positions just prior to and after the District’s inception in
January 2005. The Office of the Auditor General is making no recommendations in
this area.
District executives’ salaries generally lower than
counterparts’ nationally
In comparison with similar healthcare facilities as
measured by net revenues and type of facility, the
District’s executive salaries are generally lower than
those reported by national healthcare salary surveys.
1
The District considers its executive management to
comprise five positions (see textbox). These positions
are involved in directing, controlling, evaluating, and
developing organizational operations and resources to
ensure effective, quality healthcare.
When compared nationally to all types of hospitals and health systems or to other
teaching hospitals with similar net revenues, the District’s five executive salaries are
generally lower than reported median salaries. As shown in Table 9 (see page 34), in
a national comparison with all types of hospitals and health systems with net
revenues that are similar to the District’s, the District’s salaries for all five positions are
Office of the Auditor General
page 33
CHAPTER 3
1
To perform their analyses, auditors used 2008 healthcare salary surveys from Mercer, SullivanCotter, and Watson Wyatt
Data Services. See Bibliography, pages c-i through c-iv, for additional details. Information from the surveys is used
pursuant to licenses with the survey companies. This information is or may be proprietary and is intended and may only
be used for the purposes of this report.
Legislative Item
This audit shall examine the
personnel structure, specifically
management salaries, contract
personnel, and associated costs
and evaluate whether this
structure is consistent with and
necessary for the execution of
the statutorily designated duties
of the District.
District Executive Management Positions
• Chief Executive Officer
• Chief Operating Officer
• Chief Medical Officer
• Chief Financial Officer
• Vice-President Internal Development
1
1
In December 2008, the District changed the responsibilities and title of this
position to the Senior Vice-President and Chief External Affairs Officer.

State of Arizona
page 34
A: Comparison of the District’s Executives’ Salaries to Those of Selected National Hospitals and Health Systems
with Similar Net Revenues
District Watson Wyatt Data Services
1,2
SullivanCotter
2
Position Annual Salary
Median
Annual Salary
Number of
Organizations
Reporting
Median
Annual
Salary
Number of
Organizations
Reporting
Chief Executive Officer $367,600
$600,100 32 $601,900 56
Chief Operating Officer 330,000
331,700 42 386,700 39
Chief Medical Officer
3
315,100 330,700 34 332,700 40
Chief Financial Officer 305,000
328,700 65 343,000 64
Vice-President Internal
Development
4
172,400 205,300 24 193,500 23
B: Comparison of the District’s Executives’ Salaries to Those of Selected National Teaching Hospitals with Similar
Net Revenues
District Watson Wyatt Data Services
1,2
Mercer
1,2
Position Annual Salary
Median
Annual Salary
Number of
Organizations
Reporting
Median
Annual
Salary
Number of
Organizations
Reporting
Chief Executive Officer $367,600
$612,500 16 $605,400 38
Chief Operating Officer 330,000
379,800 20 329,500 55
Chief Medical Officer
3
315,100 338,700 18 336,000 42
Chief Financial Officer 305,000
344,100 36 307,900 71
Vice-President Internal
Development
4
172,400 205,300 11 152,800 18
Table 9: Salary Comparison Tables
As of December 2008
(Unaudited)
1
Salary survey data includes the District’s data that because of survey firm client confidentiality policies, could not be removed. See Appendix
A, pages a-i through a-v, for further details.
2
Watson Wyatt Data Services and SullivanCotter data was based on hospitals and health systems with net revenues of $400 million to $900
million whereas Mercer data was based on hospitals with net revenues of $400 million or more. See Appendix A, pages a-i through a-v, for
further details.
3
In February 2008, the District’s Chief Medical Officer retired at an annual salary of $315,100. Subsequent to his retirement until October
2008, a contracted physician filled this position on an interim basis at an estimated annual salary of $229,100. As of December 2008, this
position remained vacant.
4
In December 2008, the District changed the responsibilities and title for this position to the Senior Vice-President and Chief External Affairs
Officer with an approximate annual salary of $209,700.
Source: Auditor General staff analysis of district-provided executive salary information and Mercer, SullivanCotter, and Watson Wyatt Data
Services salary survey data.

lower than the median salaries reported. For example, the District’s Chief Executive
Officer’s salary of $367,600 was lower than the reported median salaries by at least
$232,500, and the Chief Medical Officer’s salary of $315,100 was lower than the
reported median salaries by at least $15,600. In a national comparison limited to
teaching hospitals with similar net revenues, three of the five executives’ salaries (the
Chief Executive Officer, Chief Financial Officer, and Chief Medical Officer) were lower
than reported median salaries (see Table 9, page 34). For further salary comparisons,
such as by region, see Appendix A, pages a-i through a-v.
Total compensation packages include standard benefits
but not perks
The five district executives’ total compensation packages include benefits and other
forms of compensation, but do not include perks, such as automobile allowances.
Auditors’ comparisons of other aspects of executives’ compensation packages
besides salary showed the following:
BBeenneeffiittss——
District executives, like all district
employees, receive benefits that appear to be
similar to Maricopa County’s, including district
contributions for medical and dental insurance,
the Arizona State Retirement System (ASRS)
(see textbox), and paid time off. Like other
district employees, district executives pay a
portion of their salaries for some benefits, such
as healthcare and ASRS benefits.
Paid time off for executives begins somewhat higher than for most other district
employees. As of December 2008, district executives received 26 to 29 days
personal and 7.5 days family/medical paid leave annually, while other district
employees received 15 to 29 days personal and 5 to 7.5 days family/medical
paid leave annually, depending on tenure. In addition to these paid leave
accruals, the executives received an additional 5 to 10 personal and 5 to 92
family/medical days paid leave upon hire.
1
Personal leave may be used for
vacation, illnesses, and medical appointments. Like other district employees,
the five executives receive 10 paid holidays.
For three of the District’s five executives, the District has paid additional monies
into a supplemental ASRS 401 (A) savings plan. All district employees, age 40
and older, are eligible to participate in a supplemental ASRS 401(A) plan that
1
The one district executive who received the 92 days family/medical paid leave at initial hire transferred in approximately
87 days paid sick leave from a previous position.
Office of the Auditor General
page 35
Arizona State Retirement System (ASRS)
The ASRS provides pension, disability, survivor, and
retiree health insurance benefits, and educational services
for most public sector employers in Arizona, including
state universities, community colleges, public school
districts, local and county governments, and the State of
Arizona.
Source: Auditor General staff analysis of information from the ASRS’ Web site.

State of Arizona
page 36
allows them to defer a maximum $46,000 pre-tax contribution annually from their
salaries.
1,2
Although the amount deferred may comprise employer and, as of
January 2009, employee contributions, according to district counsel, the
combined total cannot exceed the annual maximum. In addition, district counsel
explained that, because state law limits the amount of compensation that can
be considered for benefits under the regular ASRS plan, in June 2008 the
District’s Chief Executive Officer approved the District’s contributing to the ASRS
401(A) supplemental retirement savings plan for three executives.
3,4
These
included the Chief Executive, Financial, and Operating Officers whose salaries
were above the defined limit.
5
Further, a district official reported that, as of
September 11, 2008, the District had contributed a total of more than $190,000
into their supplemental retirement plans, which an outside consultant
determined would provide comparable benefits to ASRS if the employees’ full
compensation was considered under the ASRS. As of December 2008, district
counsel indicated that the District had no intention of making further
contributions to this supplemental retirement savings plan for these three
employees, at least through June 30, 2012.
The District’s executives are also eligible for the District’s tuition reimbursement
program. Under this program, employees are eligible to receive up to $5,250 per
year for tuition and book fees so that they may pursue their educational
objectives for improving job performance or developing work-related skills,
and/or enhancing professional growth opportunities within the District. In 2008,
according to a district official, the Vice-President Internal Development received
$2,448 under this program.
6
OOtthheerr
ccaasshh
ccoommppeennssaattiioonn——
The District’s other cash compensation for the five
executives appears to be significantly lower than the amounts reported by some
other hospitals in salary survey data. According to literature, other forms of cash
compensation include incentives and bonuses.
7
The District has established a
merit program that allows all district employees, including executives, to
annually receive a one-time lump sum merit payment of, according to a district
official, up to 5 percent of their salary based on performance criteria. Payment is
based on the District’s ability to pay, and the Chief Executive Officer’s and
A district official
reported that, as of
September 2008, the
District contributed more
than $190,000 to three
district executives’
supplemental retirement
plans.
1
According to district counsel, the Internal Revenue Service increases the contribution amount annually based on
increases in the cost of living, and the limit for fiscal year 2009 is $46,000.
2
Although the 401(A) plan is available to eligible participants in various state retirement plans including the ASRS, each
government unit must individually adopt the plan.
3
A.R.S. §38-746.
4
District counsel explained that the District’s Chief Executive Officer approved the contributions using contractual authority
delegated by the Maricopa County Special Health Care District Board of Directors and the District’s approved
compensation plan.
5
The fiscal year 2009 ASRS compensation limit that can be considered for benefits is $230,000.
6
In December 2008, the District changed the responsibilities and title of this position to the Senior Vice-President and Chief
External Affairs Officer.
7
Flannery, 2002

Human Resource Department’s recommendations. According to a district
official, the District’s Board determines the Chief Executive Officer’s merit
payment amount. This district official also reported that, in November 2008,
three of the District’s five executives—the Chief Operating Officer, Chief
Financial Officer, and Vice-President Internal Development—received merit
payments totaling more than $35,000.
1
These merit payments ranged from
approximately $8,600 to $16,500. By comparison, according to December 2008
healthcare salary survey data, 40 to 74 percent of Chief Operating Officers in
hospitals or health systems with net revenues similar to the District’s received or
were eligible to receive median monetary awards ranging from $62,300 to
$102,300.
2
PPeerrqquuiissiitteess——
The District does not offer perquisites, or “perks.” According to
literature, perks may include automobiles, club memberships, financial
counseling, or supplemental life, medical, or disability insurance.
3
For example,
according to January 2008 survey data, 49 to 61 percent of health system
executives were eligible to receive car allowances with an average monthly
amount ranging from $652 to $725.
4
District executives’ salaries less than those offered to
contractors before and after District’s inception
As of December 2008, the District’s executives’ salaries fell below those paid to the
contractors who held these positions for Maricopa County just prior to and after the
District’s inception. In January 2005, the District took over the fiscal and operational
responsibilities of the integrated health system from the County. When the District
was first established, its executive positions were filled mostly by contractors. These
contractor positions were eventually filled by district employees whose salaries are
generally lower than those paid to contractors. For example, as shown in Table 10
(see page 38), the District’s Chief Executive Officer is paid $367,600 annually, but the
contracted Chief Executive Officers for the County and the District when it was first
established were paid an estimated $549,100 and $571,000, respectively. Although
contractors’ salaries exceeded those paid to the District’s executives, their
compensation did not include health benefits, paid leave, or ASRS benefits.
Office of the Auditor General
page 37
1
In December 2008, the District changed the responsibilities and title of the Vice-President Internal Development to the
Senior Vice-President and Chief External Affairs Officer.
2
Mercer, 2008; SullivanCotter, 2008; Watson Wyatt Data Services, 2008
3
Flannery, 2002
4
SullivanCotter, 2008
According to a district
official, in November
2008, three district
executives received
merit payments totaling
more than $35,000.

State of Arizona
page 38
Position
Maricopa County
Contract Position
As of December 2004
(Estimated)
1
District
Contract Position
As of January 2005
(Estimated)
1
District
(Actual)
Chief Executive Officer
$549,100
$571,000
$367,600
Chief Operating Officer
457,600 475,800
330,000
Chief Medical Officer
2
216,100 216,100
315,100
Chief Financial Officer
561,600 457,600
305,000
Vice-President Internal Development
3
N/A N/A
172,400
Table 10: Comparison of Annual Contracted County and District
Executive Salaries to December 2008 District Salaries
(Unaudited)
1
Estimated annual salary was based on contractual hourly or daily pay rates.
2
The Chief Medical Officer was a county and district employee. In February 2008, the District’s Chief Medical Officer retired at
an annual salary of $315,100. Subsequent to his retirement until October 2008, a contracted physician filled this position on
an interim basis at an estimated annual salary of $229,100. As of December 2008, this position remained vacant.
3
The District created and filled this position in November 2005. In December 2008, the District changed the responsibilities
and title for this position to the Senior Vice-President and Chief External Affairs Officer with an approximate annual salary of
$209,700.
Source: Auditor General staff analysis of a Maricopa County employment contract and district-provided salary information.

Contracting practices for healthcare
personnel
The Maricopa County Special Health Care District (District) contracts with
two private entities, MedPro and Broadlane, to provide all physicians,
allied healthcare professionals, and temporary nurses to the District’s
hospital and healthcare facilities.
1
The contract with MedPro for
physicians and allied healthcare professionals contains both cost
containment and quality control features such as quality performance contract
incentives. However, this contract is also a sole-source contract that the District
inherited from the County in 2005, and the District has not re-evaluated the staffing
model provided through the contract or determined whether a sole-source contract
is still necessary. The District should re-examine whether this staffing model is still
optimal. With regard to the contract for temporary nurses, the District supplements
its own nursing staff by contracting with Broadlane for temporary nurses. Because
hiring more nurses costs less than contracting for them, the District has significantly
reduced its use of temporary nurses since 2005 by successfully working to hire more
district nurses.
District contracts for some personnel services
The District contracts for many kinds of services, ranging from laundry and cleaning
supplies and food to consulting and patient care. In fiscal year 2008, the District paid
a total of over $80 million to vendors. According to October 2008 information, the
District contracted for a variety of products and services with over 600 individuals and
entities. The scope of these contracts varied widely and included contracts for items
and services such as pest control, laundry and cleaning supplies, food, consulting,
and patient care. However, the two largest contract payments in fiscal year 2008 were
for patient-care services at the hospital and other healthcare facilities, including a $45
million contract for physician and allied healthcare professional services, and
payment of $11 million for temporary nurse services. Specifically:
In fiscal year 2008, over
$56 million was paid to
vendors to provide
physicians, allied
healthcare
professionals, and
temporary nurses.
Office of the Auditor General
page 39
CHAPTER 4
1
According to district policy, allied healthcare professionals include professionals such as physician assistants, nurse
practitioners, certified registered nurse anesthetists, and certified nurse midwives.
Legislative Item
Examine the personnel structure,
specifically management
salaries, contract personnel, and
associated costs and evaluate
whether this structure is
consistent with and necessary
for the execution of the
statutorily designated duties of
the District.

PPhhyyssiicciiaann
ccoonnttrraacctt——
The District’s hospital and other healthcare facilities are
staffed by 205 physicians and 75 allied healthcare professionals employed
through a large, sole-source contract with Medical Professional Associates of
Arizona (MedPro), a multi-specialty professional corporation. MedPro was
created in 1994 by physicians already employed by the Maricopa County
hospital.
1
According to the District, the corporation was formed in response to
the Maricopa County Board of Supervisors’ request that each department within
the county hospital separate from the hospital and create third-party groups for
service contracting.
2
The County established the contract with MedPro as a
sole-source provider in 2001.
The MedPro contract was transferred from Maricopa County to the District when
the District was established in 2005, and then in 2008 the District signed another
3-year contract with MedPro. According to the District’s contract, it is effective
for 3 years and may be extended one additional year upon mutual agreement.
3
MedPro provides the District all of its qualified physicians (medical doctors and
doctors of osteopathy), and many other credentialed healthcare professionals
such as dentists, podiatrists, physician assistants, nurse practitioners, certified
registered nurse anesthetists, and certified nurse midwives. MedPro doctors are
responsible for providing care to patients, teaching resident physicians,
supervising in most levels of management, and serving on committees such as
the patient safety and peer review committees. The allied healthcare
professionals perform a variety of functions at the District, including providing
medical care under guidance of a physician, providing anesthesia, and working
in labor and delivery. According to the District, MedPro employees are full-time
and do not practice privately, with the exception of temporary specialist
positions, such as ophthalmologists, that the District uses on an as-needed
basis.
TTeemmppoorraarryy
nnuurrsseess
ccoonnttrraacctt——
The District also has a contract to supply
temporary nurses (also known as contract nurses) to supplement the District’s
own nursing staff. In 2004, the District began contracting with Broadlane Inc.
(Broadlane), a contract negotiation and vendor management provider of
healthcare staffing services. Broadlane subcontracts with qualified temporary
nurse staffing agencies, which then provide the District with contracted
registered nurses for its hospital and healthcare facilities and other staff, such as
sitters, who specifically observe and verbally communicate patient status in the
hospital. From July through October 2008, the District used an average of 35
contract nurses each month to supplement its own nursing staff, which
averaged 823 per month. Like the District’s nurses, these contract nurses assist
State of Arizona
page 40
1
According to the District, the resulting organization was initially called the Maricopa Faculty Association, but with
additional changes in 1999, the name was changed to MedPro.
2
The District does not know why the Maricopa County Board of Supervisors requested this change in 1994.
3
These provisions are in compliance with the District Procurement Code rather than the State Procurement Code because
the District is not subject to state procurement regulations. The District should adopt and administer competitive
procurement rules necessary to administer and operate its programs and any property, according to Arizona Revised
Statutes §48-5541.01(M)(1).

in patient care by collaborating with the physicians, performing patient
assessments, and administering medication.
MedPro contract contains quality-of-care and cost
containment requirements
The District’s contract with MedPro contains various requirements designed to
encourage quality of care and cost containment, such as those related to hiring
qualified practitioners, meeting national standards required for accreditation, and
offering incentives for meeting specific performance goals.
Contract includes qualified practitioner requirements—The contract
requires that all MedPro physicians and allied health professionals be licensed
and/or credentialed in Arizona. Prior to accepting a MedPro doctor or allied health
professional to be part of the District’s medical staff, the District’s medical staff
bylaws require that the District perform three reviews of the applicant’s
professional information, such as whether he/she has professional training and
experience and has had any past disciplinary action. These three reviews are
conducted by different individuals or groups, including the Chair of the Department
to whom the application and relevant information are submitted; a credentialing
committee made up of physicians representing most departments, such as
internal medicine or surgery; and a District Medical Executive Committee that
includes all department chairs and the District’s Chief Medical Officer. The Medical
Executive Committee then submits a report and recommendation to the Maricopa
County Special Health Care District Board of Directors (Board) for final approval.
In addition, the Joint Commission requires that every physician be periodically
evaluated including a review of the physician’s performance and competence.
1
The District requires these evaluations as part of staff reappointment after their first
year and every two years thereafter. This includes review of the physician’s
performance in relation to department data for patient outcomes, such as infection
rate. Further, according to district officials, beginning in January 2009, the District
will respond to a recent Joint Commission requirement to increase the review of
department data to more than once per year to determine if there are any
physicians whose patient outcomes differ substantially from the normal ranges.
Contract requires national quality control programs—The District’s
contract with MedPro requires MedPro to participate in the quality control
programs required by national entities such as the federal Centers for Medicare
and Medicaid Services (CMS) and the Joint Commission. According to the District,
these programs require organizations to measure the quality of certain processes
that are commonly found at most healthcare facilities. Data is collected and
reported to CMS on processes such as administering aspirin on arrival for heart
Office of the Auditor General
page 41
The contract with
MedPro requires
adherence to national
quality control
programs.
1
The Joint Commission is a not-for-profit organization that evaluates and accredits healthcare programs in the United
States.

attack patients and administering an initial antibiotic within 6 hours of hospital
arrival for pneumonia patients. According to the most current national CMS data
available, between April 2007 and March 2008, the District was below the national
average for three of the four CMS measured areas.
1
The District also collects data on the Joint Commission National Patient Safety
Goals, which include processes such as implementing a program for reducing the
number of patients’ falls and communicating a complete list of patient medications
to the next provider when a patient is transferred. Information on the Joint
Commission’s Web site showed that the District had not passed 5 of the 18
National Patient Safety Goals measured in September 2007. However, in
December, Joint Commission surveyors reviewed all areas and found the District
to be in full compliance.
Contract requires participation in District’s Performance
Improvement Program—The contract requires MedPro physicians to
participate in performance improvement programs such as the District’s long-
standing, Joint Commission-required quality control program referred to as the
District’s Performance Improvement Program (PI Plan). The PI Plan’s purpose is to
act as a guide to quality healthcare services by measuring key processes and
outcomes, and identifying opportunities for change that enhance the quality of
care. Although the District has a general PI Plan, each department, such as the
behavioral health psychiatric centers and the community-based family health
centers, has individualized quality indicators that address areas’ specific needs.
For example, the department that oversees the District’s community-based family
health centers measures progress on specific goals such as decreasing the length
of patient stay and the percentage of urgent care patients who leave without care.
Performance on the indicators in the departments’ PI Plans is presented to an
executive committee, which provides accountability for quality improvement
throughout the organization. For example, a report on quality indicator progress
showed that in October 2008, the average length of a patient visit for the 11 family
health centers was 79 minutes, which is less than the 120-minute goal.
Contract provides incentives for quality and cost containment—As
shown in Table 11 (see page 44), the MedPro contract provides incentives to
MedPro for meeting goals related to quality of care and cost containment, and for
some incentives, the District is allowed to reduce MedPro payments if it does not
meet the goals. According to literature, in the healthcare field, healthcare service
costs may be contained when payment is tied to performance.
2
In addition, the
National State Auditors Association’s contracting best practices include tying
payments to deliverables in the contract provisions.
3
Between April 2008 and
State of Arizona
page 42
1
Some of the CMS measures are based on as few as 14 cases at the District, which may be too small a number to reliably
tell how the hospital is performing. According to the District, the small number of cases is because the CMS quality data
is collected for Medicare patients only and not for all patients.
2
Bokhour et al., 2006; Gaynor, Rebitzer, & Taylor, 2004; Torgerson, 2008
3
National State Auditors Association, 2003

Office of the Auditor General
page 43
January 2009, the District paid a total of over $1,086,562 in incentives to MedPro.
According to district officials, the MedPro contract incentives/penalties were added
in April 2008 as part of management’s intention to improve quality of care. The
contract includes incentives such as:
SSuuppppllyy
CChhaaiinn
IImmpprroovveemmeennttss
TTeeaamm——
One incentive (see Table 11, page 44)
provides up to $400,000 per year for collaboration between MedPro and the
District through the Supply Chain Improvements Team (Team). According to
literature, a collaborative approach between physicians and the hospital that
includes discussion of equipment purchasing and treatments helps to ensure
high service quality and cost control.
1
The Team consists of district
administration and physician members meeting to discuss possible cost
savings measures and determine vendors for the purchase of products and
equipment for medical use. According to the District, although the Team existed
prior to April 2008, the incentive was added to improve physician attendance.
The Team met monthly between July and October 2008, and opportunities for
physicians to participate should increase in the last quarter of contract year
2009. According to the contract, the District may pay MedPro physicians who
participate in the collaborative meetings an hourly compensation of $125 that
may not exceed $25,000 per year total for all physicians combined. In addition,
MedPro receives 50 percent of any cost savings the team creates up to
$375,000 per contract year. Between April and November 2008, the Team
identified cost savings totaling an estimated $500,000, which may be paid at the
end of the contract year.
EEmmeerrggeennccyy DDeeppaarrttmmeenntt——
This incentive (see Table 11, page 44) provides up to
$900,000 per year to MedPro when the Adult Emergency Department complies
with various requirements. For example, MedPro can receive up to $250,000 per
year when a review of its Adult Emergency Department shows that 90 percent
or more of the time it follows best practice processes on five of the seven CMS
Core Measures for the treatment of maladies such as heart attack and
pneumonia. The incentives are generally calculated monthly and paid the
following month, unless specified otherwise in the contract. For example,
MedPro was paid nearly $42,000 in incentives in October 2008 for its Adult
Emergency Department’s performance.
PPaattiieenntt
vviissiittss
iinn
ffeeddeerraallllyy
qquuaalliiffiieedd
hheeaalltthh
cceenntteerrss——
This area (see Table 11, page
44) includes both incentives and penalties, which means that the District may
provide up to $1,134,732 per year to MedPro for meeting goals for the number
of patient visits at the District’s 13 federally qualified healthcare centers, and that
the District may also withhold up to this same amount from MedPro payments
if it does not meet the incentive baseline requirement. The contract includes a
baseline number of appointments with patients in 2007; and the incentive is
based on exceeding the baseline in increments of 5 percent, while the penalty
will be triggered by not meeting the baseline in decrements of 5 percent. The
Between April 2008 and
January 2009, the
District paid MedPro
about $1 million for
quality and cost controls
incentives included in
the contract.
1
Torgerson, 2008; Vogenberg, Lichtig, Weinberg, & DeSantis, 2004; Williams, 2008

State of Arizona
page 44
Incentive
Maximum Annual
Incentives
Available for
Achieved Goals
Maximum
Penalties for
Not Meeting
Goals
Incentive
Payments
June 2008
through
January 2009
On-time Surgery Starts
When surgeons are in operating rooms ready to start
at 7:30 a.m. 95 percent or more of the time, MedPro
receives 100 percent of incentive. Percentage of
incentive money decreases as percentage of on-time
starts decreases. $500,000
Supply Chain Improvements
When a MedPro/district supply chain management
team meets twice a month to design and implement
cost savings initiatives, up to $25,000 is paid. Also,
when cost savings are realized, MedPro and the
District share savings at 50 percent up to a total of
$375,000. 400,000
Medical Staff Development Plan
To receive this incentive, MedPro and district
representatives must strategically create a
measurable plan for services, such as deciding how
many physicians by specialty are required. This plan
has been started, but has not yet been approved. 100,000
$ 100,000
1
Emergency Department
To receive this incentive, MedPro must meet several
goals with monetary incentive values assigned to
them. For example, up to $350,000 of the incentive is
available when 95 percent of medical record charts
are updated within 72 hours. 900,000
601,669
Family Health Clinic (FHC) and Comprehensive
Healthcare Center (CHC)
To receive this incentive, patient visit counts in the
FHCs and the CHC must meet the contract incentive
requirements for number of patients seen by staff.
Each facility will have an incentive/penalty pool, and a
facility may receive a 5 percent incentive or penalty
based on the performance of the individual facility and
another 5 percent only if the requirement is met for
the aggregate of all FHCs.
a. Each clinic (5 percent)
b. Consolidated (5 percent)
567,366
567,366
$ 567,366
567,366 265,513
Regulatory Compliance
Eight Joint Commission standards selected in the
contract must be met with 90 or 100 percent
compliance to receive this incentive. For example,
departments must use approved abbreviations or
complete post-anesthesia assessment forms. 500,000
119,380
Totals $3,534,732 $1,134,732 $1,086,562
Table 11: MedPro Contract Services Quality Control Incentives
As of January 2009
1
These incentives were earned between April and December 2008 and were paid by January 2009.
Source: Auditor General staff analysis of the April 2008 MedPro contract and the District’s January 2009 MedPro
payment detail.

incentive further requires that the actual number of patient visits be verified
daily by the clinic manager and the District’s Medical Director. Two separate
incentives are available: one incentive for when the individual centers meet the
requirement; and a second incentive when all the centers combined meet their
patient visit requirements. This incentive is reported monthly and paid
quarterly, and as of January 2009, MedPro had received over $265,000 for this
incentive.
According to the District, payments for some incentives have not yet occurred
because they are not yet due or the minimum requirement has not been met.
District should re-evaluate its model for obtaining
physician services
Although the District’s model of obtaining physician personnel through a closed,
medical staff model is typical, the unique aspect of the model is that the District
contracts with a private organization, MedPro, rather than a local university medical
school, like many teaching hospitals. Because other hospitals use different methods
to staff their hospitals and healthcare facilities, and because the District has not re-
evaluated the model since it inherited the contract in 2005, the District should analyze
whether its physician contracting practice is still optimal.
District uses closed physician staffing model—The District’s physician
staffing model has some similar characteristics to the models commonly used by
other teaching hospitals. District officials characterize their physician staffing
model as a “closed medical staff” model, meaning that the District’s physicians
are limited to only those already employed by MedPro as opposed to opening the
staff to physicians from the community. Information in literature indicates that many
hospitals are staffed by physicians and teaching faculty through a closed medical
staff model.
1
According to the District, it uses a closed medical staff model in order
to ensure continuity of care and continuity of faculty to work with medical students.
Further, the District describes its staffing model as somewhat similar to a Faculty
Practice Plan, which, according to The Managed Health Care Handbook, is a
medical group organized around a teaching program, primarily at a university.
2
In
one respect, however, the District’s model is unique: the contract is with a private
corporation rather than a local university medical school.
District should consider whether physician staffing model and
contract type is most effective—Because the District inherited the MedPro
contract and its sole-source procurement from the County in 2005, the District
should assess whether it still considers this model to be optimal and whether the
sole source is still necessary. The current medical staff model has been used since
Office of the Auditor General
page 45
1
Cuellar & Gertler, 2005; Green & Bowie, 2005
2
Kongstvedt, 2001

1994 and was transferred from Maricopa County when the District was established
in 2005. Information in literature shows that healthcare is always changing and that
there is no consensus on the “right way” to configure healthcare services because
each model has strengths and weaknesses.
1
According to the District, it has not
weighed the costs and benefits of using this staffing model versus any other
staffing model since the MedPro contract was transferred to the District in 2005.
In addition, the District has not evaluated the choice to use a noncompetitive
procurement—also known as a sole-source contract. According to a Maricopa
County 2001 document prepared to justify its use of a sole-source contract, some
of its reasons for seeking a sole-source contract with MedPro were that using a
third party reduced administrative costs for overseeing physicians, it was unlikely
that other providers would offer proposals, and the sole-source procurement
eliminated the expenses of deliberating over the procurement decision. In contrast,
other public contracts involve a periodic competitive bidding process that allows
other vendors to compete, thus driving down prices. To ensure it considers
contracting in ways that most efficiently and effectively fit its purpose and mission,
the District should perform a cost/benefit analysis of its physician staffing model,
including the continued need for a sole-source contract.
District uses contract nurses on limited basis
Although the District also contracts for some nursing personnel, most of the District’s
nursing staff, unlike its physician positions, are district employees. To help control
costs, the District has worked to increase its own nursing staff. The District requires
that staffing agencies, which provide contract nurses through the Broadlane
contract, ensure the quality of their nurses by verifying credentials and providing an
ongoing education program. In addition, the District helps ensure contract nurse
quality through orientation and performance evaluations.
District limits use of contract nurses to control costs—According to the
District, it has made a concentrated effort to control costs by limiting its use of
contracted nursing personnel. Contracted nurses cost more per hour than district
nurses. For example, according to district information, the District’s average cost
for employing a Registered Nurse (RN) is about $49 per hour (salary and benefits),
whereas the average cost for a contracted RN can range from about $56 to $63
per hour. As shown in Table 12 (see page 47), between fiscal years 2005 and 2009,
the average monthly number of district nurses had increased by about 200 nurses
and its use of contracted nurses had declined to only about 4 percent. However,
according to district officials and literature, because of factors such as increasing
patient volume and a nation-wide nursing shortage, many hospitals, including the
District’s, will continue to need to use some contracted nurses.
2
State of Arizona
page 46
1
Burns, Morrisey, Alexander, & Johnson, 1998; Kongstvedt, 2001; Mallon, 2004
2
American Association of Colleges of Nursing, 2002; PriceWaterhouseCoopers, 2003; Reis, 2005; Stiehl, 2004
As of fiscal year 2009,
only about 4 percent of
the District’s total
nursing staff were
contract nurses.
The MedPro contract
was inherited from the
County and has not
been re-evaluated by
the District.

District takes steps to ensure
contract nurse quality—The
District requires the staffing agencies
who provide the contracted nurses to
ensure their qualifications, including
verifying credentials and providing
some continuing education. Further,
the District provides an orientation
and performance reviews to
contracted nurses.
Contracted staffing agencies ensure
contracted nurses are qualified by
verifying credentials and providing
continuing education. Specifically:
LLiicceennssuurree aanndd ccrreeddeennttiiaall
vveerriiffiiccaattiioonn——
To meet district
contracting requirements,
staffing agencies verify the
qualifications of their nursing
staff. However, according to the
District, before a contract nurse may proceed to an assignment, information
such as licenses and certifications must be on file with the District.
In addition, the contractor, Broadlane, performs an initial business and clinical
survey of all subcontracted staffing agencies, ensuring that the agencies are
complying with state and federal regulations. Further, Broadlane pulls a
sample of nurse files to check for current licensure, certifications, education,
background checks, health checks, and other specific information. Lastly,
Broadlane conducts additional surveys annually or at the District’s request.
CCoonnttiinnuueedd
nnuurrssiinngg
eedduuccaattiioonn
ooppppoorrttuunniittiieess——
The District’s Broadlane contract
requires staffing agencies to provide their own education programs and
maintain records of any training a nurse completed while on assignment. In
addition, according to the District, contracted nurses do not receive continuing
education through the District. However, they may choose to attend
presentations or lectures offered through the District if their attendance would
not result in the District’s incurring costs.
Office of the Auditor General
page 47
Average Monthly Number of Nurses
Fiscal
Year District Contracted Total
Percentage of
Contracted Nurses
2005
2
611 109 720 15.14%
2006 604 73 677 10.78
2007 614 111 725 15.31
2008 801 55 856 6.43
2009
3
823 35 858 4.08
Table 12: Comparison of the Average Monthly
Number of District Nurses to Contracted Nurses
1
Fiscal Years 2005 through 2009
2,3
1
The average monthly number of nurses was calculated by adding the total nursing
hours worked for the month and dividing by the hours available in a month based on
an 8-hour workday. The average for the year was determined by adding these
monthly totals and dividing by 12 to determine the FTE (full-time equivalent).
2
The District was established on January 1, 2005; therefore, fiscal year 2005 amounts
are for the period January through June 2005.
3
Amounts for fiscal year 2009 include data through October 2008.
Source: Auditor General staff analysis of district fiscal year data compiled from payroll
information for the period January 2005 through October 2008.

The District provides new contracted nurses with orientation and performance
reviews. Specifically:
CCoonnttrraacctt
nnuurrssee
oorriieennttaattiioonn
pprroocceedduurreess——
According to district information, a
nurse contracted for a long-term assignment will receive the same 6-day,
district-provided orientation that is provided to district nurses. Orientation
includes information and instruction regarding risk management and incident
reporting, an overview of current patient safety goals, and “skills station”
testing where the District requires nurses to perform basic medical tasks in a
trainer’s presence to demonstrate competence in those areas. Additional unit-
level orientation is conducted once the contract nurse arrives on the unit.
Contract nurses who will be employed for only a few days receive a 1-day
orientation.
RReegguullaarr
ppeerrffoorrmmaannccee
rreevviieewwss——
According to district officials, to help ensure
the performance level of contract nurses, the district unit that the contracted
nurse is assigned to completes a performance evaluation form. For example,
nurses with long-term assignments are evaluated at the request of their
agency once an assignment is complete. Nurses with short-term assignments
are evaluated monthly, or anytime they are moved to work on a new unit.
Recommendation:
4.1. Because the District inherited the MedPro contract and its sole-source
procurement from the County in 2005, the District should assess whether it still
considers this model to be optimal compared to other models and whether the
sole source is still necessary, and take appropriate action based on the results
of the assessment.
State of Arizona
page 48

Medical services to indigents
Since its inception, the Maricopa County Special Health Care District
(District) has had a program to serve indigent individuals who are not
eligible for other healthcare programs. The District’s eligibility
requirements and payment policies have changed over time, but the
program has always offered both emergency and nonemergency
services, such as outpatient surgeries and doctor’s visits when a patient
is ill. During fiscal year 2008, the program served approximately 39,540
individuals and had about $32 million in uncompensated medical services costs.
1
The number of individuals served has not been restricted as the enrollment has
increased from fiscal year 2007, but the uncompensated costs associated with these
patients declined by about $7.5 million because of decreases in more costly inpatient
visits. The Office of the Auditor General is making no recommendations in this area.
Eligibility and program fees have changed over time
One of the District’s primary statutory missions is to serve the medically underserved,
and its program to do so—now called Copa Care—has changed over the past few
years. According to district documents, the program has always provided people of
all ages with both emergency and nonemergency medical services, such as hospital
emergency services for severe or life-threatening injuries as well as doctor’s visits
when a patient is ill or pregnant. Further, the program has always been directed to
people who are uninsured or underinsured and are ineligible for other healthcare
service programs, such as the State’s Medicaid program. However, eligibility
requirements and payment policies have changed since the District was created.
Providing medical services to uninsured and underinsured people is a common
practice among hospitals in the United States. For example, federal law requires that
if a hospital determines that a patient has an emergency medical condition, the
hospital must provide the treatment necessary to stabilize that person or arrange for
Office of the Auditor General
page 49
CHAPTER 5
Legislative Item
The audit shall examine and
identify the amount of medical
assistance furnished to indigent
individuals who are uninsured
and ineligible for Medicaid and
other health service programs
and identify policies that have
changed to restrict services to
this population.
1
These uncompensated medical services costs are for the District’s charity care program only, and do not represent the
District’s total uncompensated care costs which were approximately $87 million in fiscal year 2008 (see Chapter 6, pages
55 through 63).

an appropriate transfer to another healthcare facility, regardless of the patient’s ability
to pay or his/her citizenship status.
1
Also, according to the American Hospital
Association, in October 2007, more than 86 percent of the over 5,700 hospitals
registered in the United States reported that they provided charity care services.
2
The
District defines charity care as services provided to uninsured, low-income, and
underinsured patients who are financially unable to satisfy their debt.
The District’s program has changed a few times, as follows:
JJaannuuaarryy
11,,
22000055——PPrrooggrraamm
aallrreeaaddyy
iinn
ppllaaccee
wwaass
rreettaaiinneedd..
When the District was
first established, it used the charity care policy that was in effect at Maricopa
County before the integrated health system was transferred to the District. This
policy restricted program eligibility to people who did not qualify for other
healthcare programs, such as the State’s Medicaid program administered by
the Arizona Health Care Cost Containment System (AHCCCS), and whose
income was less than or equal to 200 percent of the federal poverty guidelines.
This means that people whose income was more than 200 percent above the
guidelines would not qualify for the District’s charity care program. The federal
poverty guidelines establish income levels, based on household size, at or
below which a person is considered to be impoverished (see textbox for 2008
federal poverty guidelines).
Under this charity care policy, eligible persons’ medical fees were discounted
based on income and household size categories. However, if a patient was
seeking nonemergency services and was unable to pay his/her bill in full, he/she
was not provided medical services during the visit.
JJuullyy
11,,
22000066——EElliiggiibbiilliittyy
aanndd
sseerrvviicceess
wweerree
eexxppaannddeedd
aanndd
aa
nneeww
ffeeee
sscchheedduullee
wwaass aaddoopptteedd..
Starting in fiscal year 2007, the District established its own, less-
restrictive eligibility policy for the program. Under this policy, although individuals
still had to be determined ineligible for other healthcare programs such as
Medicaid, eligibility was not capped at a specific income amount. Also, the
policy expanded covered services. For example, pharmaceuticals for primary
care and specialty care patients were not covered under the previous policy, but
were added to the District’s policy. In addition, using AHCCC
S’ fee schedule
and the federal poverty guidelines, the District established its own fee schedule.
For example, patients whose income was between 301 and 500 percent of the
federal poverty guidelines were expected to pay 125 percent of the AHCCCS
fees for outpatient services. Further, under this policy, although participants did
not have to pay for their services in full before receiving treatment, depending on
their income level, participants were expected to provide a payment or a deposit
and were billed for any remaining amount.
State of Arizona
page 50
2008 Federal
Poverty Guidelines
Source: United States Department of Health
and Human Services. (2008). 2008
Poverty guideline computations.
Retrieved January 23, 2008, from
http://aspe.hhs.gov/pover
ty/08com
putations.shtml
PPeerrssoonnss
iinn
FFaammiillyy
oorr
HHoouusseehhoolldd
IInnccoommee
<<
1 $10,400
2 $14,000
3 $17,600
4 $21,200
1
42 U.S.C.A. §1395dd.
2
American Hospital Association, 2007

JJuullyy
11,,
22000088——FFeeeess
iinnccrreeaasseedd
ffoorr
ssoommee
ppaarrttiicciippaannttss..
The District changed the
name of this program to Copa Care, and for fiscal year 2009, the program’s
eligibility requirements remain the same as described in the bullet above. In
addition, the District continues to charge program participants for services, but
the District increased fees for some program participants because of concerns
about the program’s rising costs raised by the Maricopa County Special Health
Care District Board (Board).
These concerns resulted in the District’s
seeking program fee information from other
hospitals. According to district officials, it sent
surveys to the 28 members of the National
Association of Public Hospitals to learn about
their financial assistance programs. The
District received 11 surveys back, and
according to district officials, it found that the
District generally provided more generous
discounts to individuals with higher income
levels. Therefore, the District increased fees for
patients whose income is greater than 200
percent of the federal poverty guidelines. For
example, patients who needed outpatient
services and whose income is 301 to 500
percent above the federal poverty guidelines
had their fees increased from 125 percent to
175 percent of the AHCCCS fee schedule,
and are required to provide a $300 deposit
prior to receiving services. Further, the fees
established for patients with higher income
amounts can now be higher than the fee a
privately insured individual’s insurance
company pays for the same service (see
textbox).
Office of the Auditor General
page 51
Examples of Fees for Copa Care Participants
with a Household Size of One
Compared to Other Rates
SSeerrvviiccee:: HHoossppiittaall oouuttppaattiieenntt ssuurrggeerryy ttoo rreeppaaiirr aa rroottaattoorr ccuuffff
AHCCCS rates for this service:
• $1,912
Amount charged for a privately insured patient:
• $896-$2,211—If the patient is privately
insured and the insurance carrier has a
contracted price for this procedure.
Amount charged Copa Care patient:
• $25—If the patient’s annual income is less
than or equal to $10,400 or 100 percent of the
federal poverty guidelines.
• $574 with a $50 deposit—If the patient’s
annual income is $10,504 to $15,600 or 101
to 150 percent over federal poverty guidelines.
• $3,345 with a $300 deposit—If the patient’s
annual income is $31,304 to $52,000 or 301
to 500 percent over the federal poverty
guidelines.
• $4,779 with a $500 deposit—If the patient’s
annual income is $52,104 or more, or 501
percent or more over federal poverty
guidelines.
Source: Auditor General staff analysis of the January 2008 Federal Poverty Guidelines,
the District’s July 1, 2008, Copa Care fee schedule, and other district rate
information.

Program costs and population served
The District did not begin capturing uncompensated care cost and participant data
for its charity care program, now called Copa Care, until it established its own
charity care policy in fiscal year 2007. As shown in Table 13, during fiscal years
2007 and 2008, the program served 36,121 and 39,540 individuals, respectively. In
fiscal year 2008, the District recorded more than 90,000 visits from these 39,540
individuals. Most of the visits were adult outpatient and emergency medical
services. Other types of visits included inpatient and dental services. Although the
program served more individuals in fiscal year 2008, its uncompensated medical
services costs decreased. According to the District, the reduction resulted from
increased patient revenue and decreased operating costs. For example, inpatient
costs are much higher than outpatient costs, and during fiscal year 2008, there
were fewer inpatient visits.
During fiscal year 2008, the program served participants of all ages, with the
median age of patients being 30. Most patients were female (55 percent). Further,
as illustrated in Table 14 (see page 53), 68 percent of patients were Hispanic and
62 percent of patients had an income that was 301 percent or more above the
federal poverty guidelines.
State of Arizona
page 52
Fiscal Year
Patients Served Patient Revenue
Uncompensated Medical
Services Costs
1
2007
36,121 $2,693,000 $39,466,000
2008
39,540 4,095,000 31,953,000
Table 13: Charity Care Patients, Revenues, and Costs
Fiscal Years 2007 and 2008
(Unaudited)
1
These costs represent the District’s direct operating costs that are discounted for the patients in its charity care
program, now called Copa Care. For fiscal year 2008, the District had a total of approximately $87 million in
uncompensated care costs (see Chapter 6, pages 55 through 63).
Source: Auditor General staff analysis of the District’s unaudited billing data for fiscal years 2007 and 2008 and
notes to the fiscal year 2008 audited financial statements.

Office of the Auditor General
page 53
Age of Patients
Number of
Patients
Percentage of
Patients
0-10 years 5,186 13%
11-20 years 5,474 14
21-40 years 18,047 46
41-50 years 5,899 15
51-65 years 4,126 10
66 years and over 808 2
Ethnicity of Patients
Unknown 796 2%
Other 1,460 4
African American 3,337 8
Caucasian 7,022 18
Hispanic 26,925 68
Income Level of Patients over Federal Poverty Guidelines
Other
1
376 1%
0-100% 8,102 21
101-150% 3,695 9
151-200% 1,342 3
201-300% 1,390 4
301% and over 24,635 62
Table 14: Charity Care Program Patient Demographics
Fiscal Year 2008
(Unaudited)
1
Fees for these patients, who include the homeless, are not based on income
level.
Source: Auditor General staff analysis of fiscal year 2008 charity care program
demographic information from the District’s STAR patient accounting
system as of November 6, 2008.

State of Arizona
page 54

Uncompensated care costs
In fiscal year 2008, the Maricopa County Special Health Care District
(District) had approximately $87 million in uncompensated care costs—
that is, costs incurred in providing care to people the District does not
expect to receive payment from. The federal government’s Medicaid
Disproportionate Share Hospital (DSH) Payments Program reimburses
states for a portion of these costs. In Arizona, the Arizona Health Care
Cost Containment System (AHCCCS) administers this program, which
involves determining which hospitals qualify based on established
criteria, and then distributing the DSH monies to these hospitals
according to legislative appropriations. In fiscal year 2008, Arizona
received nearly $94 million in federal DSH monies. AHCCCS distributed
the monies as follows: approximately $4.2 million went to the District,
approximately $17.3 million went to the private hospitals, and
approximately $72 million was deposited in the State General Fund. In
addition, AHCCCS distributed approximately $9 million from the State
General Fund to the private hospitals, which is the required state match, and
according to AHCCCS resulted in a net deposit to the State General Fund of
approximately $63 million of federal DSH monies. The District believes it should
receive more DSH money because, as the State’s primary safety net hospital, it has
the largest amount of uncompensated care costs and it must certify its costs for the
State to receive a federal DSH payment. The Office of the Auditor General is making
no recommendations in this area.
Federal government helps states cover uncompensated
care costs
Congress established the DSH program in 1981. The federal Centers for Medicare
and Medicaid Services (CMS) administers this program, which reimburses states for
Office of the Auditor General
CHAPTER 6
page 55
Legislative Item
The audit shall examine the
amount of uncompensated care
provided on an annual basis by
the District and measure this
amount in relation to the amount
of uncompensated care provided
by facilities of the District before
the formation of the District, to
the amount of uncompensated
care provided by facilities of the
District before the
implementation of Proposition
204, and to the amount of
uncompensated care reported by
other private hospitals in Arizona
and public hospitals in other
states.

a portion of their hospitals’ uncompensated care costs. Hospitals incur
uncompensated care costs when they provide medical care, but do not receive
payment for the services provided. According to a report on Medicaid and the
uninsured, the DSH program not only provides support for uncompensated care, but
also helps hospitals deal with low Medicaid reimbursement rates that are frequently
less than hospitals’ costs.
1
The federal government shares in the cost of DSH
expenditures based on a state’s Federal Medical Assistance Percentage.
2
However,
to control DSH payments to states, the federal government also establishes an
annual limit or allotment for each state. Arizona began participating in the DSH
program in 1992. In fiscal year 2008, Arizona’s federal allotment for the DSH program
was approximately $95 million. For fiscal year 2009, the federal DSH allotment for
Arizona is approximately $102 million. The allotment represents the total federal
amount that a state can drawn down from the federal government for that year.
AHCCCS administers Arizona’s DSH program
AHCCCS, the State’s Medicaid agency, administers the State’s DSH program.
Administering the DSH program involves working with CMS to establish a method for
determining which Arizona hospitals can be considered DSH-eligible and how to
calculate uncompensated care costs, as well as distributing the DSH monies
according to legislative appropriations.
AHCCCS’ method for calculating uncompensated care costs changed in fiscal year
2008. According to an AHCCCS official, although CMS had never communicated
any concerns with its prior methods, because AHCCCS was updating the terms and
conditions for its Medicaid program, CMS also required changes to Arizona’s DSH
program.
3
According to AHCCCS, the most significant changes to its DSH program
were a change to a more reliable data source for determining a hospital’s eligibility
and calculating uncompensated care costs, and the requirement for governmentally
operated hospitals to certify their uncompensated care costs.
4
Key aspects of
AHCCCS’ DSH calculation methods include:
DDeetteerrmmiinniinngg
eelliiggiibbiilliittyy——
Starting in fiscal year 2008, Arizona hospitals interested
in receiving a DSH payment must apply through AHCCCS. AHCCCS then uses
data submitted by the hospital to determine if it is eligible. The data AHCCCS
uses includes standardized information that hospitals report to CMS, such as
total inpatient days, and AHCCCS data, such as state payments a hospital
received for state programs such as the Department of Economic Security’s
1
Hadley, Holahan, Coughlin, & Miller, 2008
2
Federal Medical Assistance Percentage (known as FMAP) is the percentage of federal matching dollars available to a
state to provide Medicaid services. For Arizona, in fiscal year 2008 the federal match was 66.2 percent.
3
AHCCCS has a waiver granted by the federal government for its Medicaid program that allows it to not follow certain
federal statutes and regulations. However, AHCCCS must run its program under Special Terms and Conditions required
by the federal government. Included in these terms and conditions are the methods for the DSH program.
4
The new process established in 2008 uses some hospital data from a Medicare cost report, which AHCCCS considers
more reliable than data from an accounting report submitted by hospitals to the Department of Health Services.
State of Arizona
page 56

Comprehensive Medical and Dental Program. Using this information, AHCCCS
applies CMS-approved eligibility criteria, which are primarily related to the
proportion of Medicaid or low-income patients a hospital serves compared to its
total patients. For example, to be eligible, hospitals must serve a higher
proportion of Medicaid or low-income patients than other hospitals.
Governmentally operated hospitals are required to submit data to AHCCCS for
calculating uncompensated care costs, but do not have to go through the DSH
eligibility calculation process. In fiscal year 2008, 37 private hospitals in Arizona
were eligible for DSH monies. In addition, Arizona has two governmentally
operated hospitals: the Arizona State Hospital (ASH), and the District’s hospital,
called the Maricopa Medical Center.
1
CCaallccuullaattiinngg
uunnccoommppeennssaatteedd
ccaarree
ccoossttss——
AHCCCS then calculates the amount
of DSH-uncompensated care costs for each hospital. This calculation is based
on both uncompensated care costs for Medicaid patients, known as a Medicaid
shortfall, and uncompensated care costs for uninsured patients. For private
hospitals, AHCCCS determines the relative proportion of each hospital’s
uncompensated care costs and uses this in part to help determine how to
distribute among the private hospitals the amount of DSH monies that the
Legislature appropriates for private hospitals.
OObbttaaiinniinngg
cceerrttiiffiiccaattiioonn
aanndd
rreeqquuiirreedd
ssttaattee
mmaattcchh——
If a hospital is a
governmentally operated hospital, beginning in fiscal year 2008, it must certify
the public expenditures it or the State is claiming for federal DSH
reimbursement. This requirement does not apply to private hospitals because
federal regulations allow only state and local governmental units to fund the
nonfederal share of Medicaid expenditures. Public expenditures are state or
local tax dollars that were used to satisfy the governmentally operated hospitals’
cost of providing services to Medicaid and uninsured individuals. Therefore, the
federal DSH monies are effectively a repayment of the federal share of the
uncompensated care costs. In addition, the State is required to appropriate
state monies as a required state match for the private hospitals.
2
AHCCCS then
uses the certifications and state match to obtain federal DSH reimbursement for
the State. Without these certifications and the state match for the private
hospitals, Arizona would not be eligible to use the federal DSH allotment to the
State.
As illustrated in Table 15 (see page 58), in fiscal year 2008 the State received
nearly $94 million in federal DSH reimbursements. Specifically, ASH certified that
it had approximately $28 million in uncompensated care costs, which based on
the federal share of these costs enabled the State to receive approximately $19
million in federal DSH reimbursements. The District certified that it had
approximately $87 million in uncompensated care costs, which, based on the
1
The Arizona State Hospital provides court-ordered treatment to individuals suffering from a behavioral health illness that
has severely impaired their functioning and their ability to be maintained in the community.
2
The required state match for the private hospitals is the difference between the FMAP and 100 percent. For fiscal year
2008 Arizona’s state match was 33.8 percent.
Office of the Auditor General
page 57

State of Arizona
page 58
federal share of these costs enabled the State to receive approximately $57.5
million in federal DSH reimbursements. Finally, for the uncompensated care
costs for private hospitals that the State claims, as mentioned previously,
Arizona is required to provide a state match. Although the private hospitals had
a total of approximately $531.5 million in uncompensated care costs in fiscal
year 2008, based on the approximately $9 million the Legislature appropriated
for the state match, the State claimed a total of approximately $26 million in
uncompensated care costs for private hospitals. This enabled the State to
receive approximately $17.3 million in federal DSH reimbursements.
DDiissttrriibbuuttiinngg
aalllloottmmeenntt
aanndd
rreeccoonncciilliinngg
uunnccoommppeennssaatteedd
ccaarree
ccoossttss——
Once the
State receives the DSH allotment from CMS, AHCCCS distributes the monies
according to legislative appropriations and the associated budget reconciliation
bill. In fiscal year 2008 (see Table 15), all of the approximately $19 million in
federal DSH reimbursements that the State received due to ASH’s
uncompensated care costs certification was deposited in the State General
Fund because ASH receives a State General Fund appropriation. In that same
fiscal year, of the approximately $57.5 million in federal DSH reimbursements
that the State received due to the District’s uncompensated care costs
Hospital
Arizona’s Claimed
Uncompensated
Care Costs
Federal DSH
Reimbursements
DSH Amount
Distributed to
Hospitals
Amount Deposited in
(Appropriated from)
State General Fund
Arizona State Hospital
$ 28,474,900
$18,850,384
$ 0
$18,850,384
Maricopa County
Special Health Care
District
86,920,707
57,541,508
4,202,300
53,339,208
Private Hospitals (37)
1
26,147,700
17,309,777
26,147,700
2
(8,837,923)
Total
$141,543,307
$93,701,669
$30,350,000
$63,361,669
Table 15: Arizona Hospitals’ Uncompensated Care Costs Claimed and Related Federal DSH
Reimbursements and Distributions
Fiscal Year 2008
(Unaudited)
1
In fiscal year 2008, AHCCCS determined that the 37 private hospitals that were eligible to receive a DSH payment had
approximately $531.5 million in uncompensated care costs; however, based on the state match amount of approximately $9
million, which the Legislature appropriated from the State General Fund, Arizona was able to claim approximately $26 million
in private hospital uncompensated care costs.
2
Of the approximately $26 million in DSH monies distributed to the private hospitals, approximately $9 million was the required
state match, which the State General Fund provided.
Source: Auditor General staff analysis of AHCCCS and JLBC information for fiscal year 2008.

Office of the Auditor General
page 59
certification, the Legislature appropriated $4.2 million to the District, with the
remaining $53.3 million being deposited in the State General Fund. Finally, in
fiscal year 2008, the Legislature appropriated approximately $9 million from the
State General Fund and approximately $17 million in federal DSH monies for the
private hospitals. AHCCCS then proportionately distributed the combined federal
and state amount, approximately $26 million, among the eligible qualifying
private hospitals. The legislative appropriations were the same for fiscal year
2009, but in January 2009, the Legislature eliminated the fiscal year 2009 DSH
appropriation for the District and private hospitals.
1
However, according to
AHCCCS’ approved DSH methodology, it is required to make a minimum
payment of $5,000 to all qualifying private hospitals to maintain the DSH program
in Arizona. AHCCCS is working with CMS to determine the minimum required
private DSH distribution and to allocate a minimum of $500,000 among the
private hospitals.
In making distributions, AHCCCS must take into account that the federal DSH
monies Arizona receives are a reimbursement for estimated expenditures.
Because of timing differences in the state and the federal fiscal years as well as
when the Medicare cost report data, which is used in part of the calculation, is
finalized, the uncompensated care cost amounts AHCCCS calculates are an
estimate. CMS requires that this estimate be reconciled when the data is
finalized.
Arizona’s uncompensated care costs and DSH payment
distributions
Since Arizona began participating in the DSH program, it has distributed monies to
three groups: (1) public or governmentally operated hospitals, (2) private hospitals,
and (3) the State General Fund. As just discussed, in fiscal year 2008 various changes
were made to the DSH program; therefore, Table 16 (see pages 60 and 61) presents
uncompensated care costs and distributions related to the DSH program for fiscal
years 2001 through 2007.
2
As Table 16 shows (see pages 60 and 61), during fiscal years 2000 through 2007,
AHCCCS’ calculations of Arizona's total uncompensated care costs ranged from a
low of approximately $266 million in fiscal year 2001 to a high of approximately $732
million in fiscal year 2007. The Maricopa County Medical Center's or the District’s
calculated uncompensated care costs have ranged from about $46 million in fiscal
year 2001 to about $98 million in fiscal year 2007.
1
Laws 2009, 1
st
S.S., Ch. 4, §7.
2 Table 16 does not include uncompensated care costs for public hospitals in other states. Although the Legislature
requested this information, auditors determined that states may have different methods for calculating uncompensated
care costs and so it is not reasonable to compare these costs from state to state.

State of Arizona
page 60
Fiscal Year Hospital
AHCCCS' Calculated
Uncompensated
Care Costs
Monies
Received
Related to
DSH
1
Percent of
Costs
Reimbursed
by DSH
Monies
Prior to Proposition 204 Implementation
2000 Arizona State Hospital $ 27,041,236
2
$ 0
3
0%
Kino Community Hospital
4
15,258,263 6,102,000 40
Maricopa County Medical Center 91,817,163 13,140,300 14
Private hospitals (26) 247,580,812 15,150,000
5
6
State General Fund N/A
6
46,607,700
Total 381,697,474
81,000,000
2001 Arizona State Hospital 30,465,328
2
0
3
0
Kino Community Hospital
4
13,253,518 6,102,000 46
Maricopa County Medical Center 45,895,542 13,140,300 29
Private hospitals (28) 176,100,397 15,150,000
5
9
State General Fund N/A
6
49,442,700
Total 265,714,785
83,835,000
A
fter Proposition 204 Implementation
2002 Arizona State Hospital 41,893,766
2
0
3
0
Kino Community Hospital
4
21,113,161 0 0
Maricopa County Medical Center 53,657,062 0 0
Private hospitals (33) 168,264,519 20,250,000
5
12
State General Fund N/A
6
65,391,855
Total 284,928,508
85,641,855
2003 Arizona State Hospital 28,474,900
2
0
3
0
Kino Community Hospital
4
15,939,539 281,000 2
Maricopa County Medical Center 71,593,438 5,109,800 7
Private hospitals (38) 227,576,305 24,959,600
5
11
State General Fund N/A
6
51,857,989
Total 343,584,182
82,208,389
2004 Arizona State Hospital 36,211,520
2
0
3
0
Maricopa County Medical Center 67,568,856 4,202,300 6
Private hospitals (38) 430,210,517 26,147,700
5
6
State General Fund N/A
6
65,019,400
Total 533,990,893
95,369,400
2005 Arizona State Hospital 37,568,943
2
0
3
0%
Maricopa County Special Health
Care District 89,621,423 4,202,300
7
5
Private hospitals (37) 336,160,714 26,147,700
5
8
State General Fund N/A
6
65,019,400
Total 463,351,080
95,369,400
(Continued)
Table 16: Arizona Hospitals’ Uncompensated Care Costs and
Monies Received Related to DSH
Fiscal Years 2000 through 2007
(Unaudited)

Office of the Auditor General
page 61
Fiscal Year Hospital
AHCCCS' Calculated
Uncompensated
Care Costs
Monies
Received
Related to
DSH
1
Percent of
Costs
Reimbursed
by DSH
Monies
After Proposition 204 Implementation
2006 Arizona State Hospital 43,524,967
2
0
3
0
Maricopa County Special Health
Care District 83,750,394 4,202,300 5
Private hospitals (37) 430,648,729 26,147,700
5
6
State General Fund N/A
6
62,319,777
Total 557,924,090
92,669,777
2007 Arizona State Hospital 34,757,791
2
0
3
0
Maricopa County Special Health
Care District 97,865,664 4,202,300 4
Private hospitals (38) 599,212,330 26,147,700
5
4
State General Fund N/A
6
65,019,400
Total 731,835,785
95,369,400
1
The amounts listed in this column represent the net amount each entity received. Prior to fiscal year 2008, the Legislature
appropriated State General Fund monies as a state match to both private and public hospitals and then used intergovernmental
transfers to return a portion of the payments made to public hospitals to the State General Fund. The amounts listed for Kino
Community Hospital and Maricopa County Medical Center/Maricopa County Special Health Care District came from audited
financial statements. The amounts listed for the Arizona State Hospital and private hospitals are based on AHCCCS and JLBC
information. Finally, the amounts listed for the State General Fund are calculated estimates based on the federal allotment
amount CMS reported, as of January 2009, that the State had used, less any amounts received by the hospitals.
2
Federal regulations limit the amount of uncompensated care costs that an Institution for Mental Disease can claim under the DSH
program. According to a CMS official, Arizona's limit is $28,474,900. So, even if ASH's uncompensated care costs are higher
than that amount, it is only eligible to receive federal reimbursement for the $28 million amount.
3
According to JLBC information, the Arizona State Hospital does not receive any DSH payments because it receives a State
General Fund appropriation.
4
Kino Community Hospital was a public hospital located in Pima County. However, after fiscal year 2003, it was no longer
considered a county hospital because in fiscal year 2004, University Physicians Inc. assumed full fiscal and operating
responsibilities for the Hospital.
5 The amount private hospitals receive includes the required state match, which the State General Fund provides (see footnote 2,
page 57 for more information).
6
Only hospitals report uncompensated care costs.
7
On January 1, 2005, Maricopa County, which was operating the healthcare system, transferred the system’s fiscal and
operational responsibilities to the new Maricopa County Special Health Care District; therefore, Maricopa County received half
of the $4.2 million allocated, and the District received the other half.
Source: Auditor General staff analysis of notes to county audited financial statements, and AHCCCS, CMS, and JLBC information
for fiscal years 2000 through 2007.
Table 16: Arizona Hospitals’ Uncompensated Care Costs and
Monies Received Related to DSH
Fiscal Years 2000 through 2007
(Unaudited)
(Concluded)

State of Arizona
page 62
During fiscal years 2000 through 2007, the County/District received a DSH payment
to help cover a portion of its costs in every year except 2002. This was the year that
Proposition 204 was implemented. Proposition 204 was a ballot initiative, passed in
November 2000, in which Arizona voters voted to use tobacco settlement monies to
increase AHCCCS healthcare coverage from people living at 34 percent or less of
the federal poverty level to 100 percent or less of the federal poverty level.
1
According
to an AHCCCS official, the DSH monies were used to help offset the State’s
increased costs for providing healthcare services to more people as well as eligibility
determination and indigent care costs formerly paid for by the counties.
2
In fiscal year 2003, the Legislature appropriated to the County $5.1 million in DSH
monies. Since fiscal year 2004, the Legislature has appropriated to the County or the
District $4.2 million annually in DSH payments. Auditors were unable to obtain any
conclusive information on how this amount was determined, but according to various
interviews, this amount was roughly equal to the amount of state funding the
Maricopa County Medical Center received under a state-only emergency services
program that was eliminated in fiscal year 2002. According to the District, it was not
involved in any discussions related to determining the $4.2 million amount.
District believes it should receive more DSH money
The District believes that it is entitled to receive a larger portion of the State’s DSH
payment. As the State’s primary safety net hospital, the District believes it incurs the
majority of the State’s uncompensated care costs, which must be certified to draw
down some of the federal DSH monies.
3
Thus, according to district officials, it should
receive the full federal reimbursement for the amount it certifies, which is
approximately $53.3 million more of the State’s DSH payment. Also, the District feels
that it has not been adequately involved in discussions about the DSH program. For
example, according to district officials, it was not informed that CMS required
AHCCCS to change the DSH methodology until the District was told that it needed
to certify its uncompensated care costs. In addition, according to a letter to the
Governor from the Maricopa County Special Health Care District Board of Directors
(Board), for years the District has had concerns about the amount of DSH monies it
receives. The District’s Board initially refused to certify the costs. AHCCCS filed a
lawsuit against the District to obtain the certification, but the lawsuit was dismissed
when the District agreed to certify the fiscal year 2008 amount. However, because the
1
The tobacco settlement monies were the result of a lawsuit filed by the attorneys general of 46 states, including Arizona.
2
According to a 2003 AHCCCS memorandum that analyzed data from the eligibility enrollment report, by September 2003
AHCCCS enrollment had increased by 74 percent since Proposition 204 was implemented in 2002, and 33 percent of
that growth was due to the proposition.
3 According to Weinick & Billings, Introduction: Tools for Monitoring the Health Care Safety Net, healthcare safety net was
defined as follows, “Those providers that organize and deliver a significant amount of healthcare and other health-related
services to uninsured, Medicaid, and other vulnerable patients” (as cited Institute of Medicine, 2000).

District still has concerns with the amount of DSH monies it receives, it has filed an
appeal with AHCCCS. As of January 2009, this appeal, which will be heard by the
Office of Administrative Hearings, has been delayed until April 2009 while the District
works with AHCCCS and the Governor’s Office to identify other potential sources of
money to help cover a greater portion of the District’s uncompensated care costs.
Office of the Auditor General
page 63

State of Arizona
page 64

Salary survey analysis methodology and
additional salary information
Chapter 3 (pages 33 through 38) and this appendix contain several tables showing
comparisons of the Maricopa County Special Health Care District’s (District)
executive management salaries to median salaries for comparable positions
reported in national salary surveys. This appendix also describes the methodology
auditors used to produce the results in those tables. The Office of the Auditor General
obtained salary surveys from three nationally recognized salary survey companies:
Mercer, SullivanCotter, and Watson Wyatt Data Services.
1
All three companies
provide documentation describing the source of the salary data, and this can be
found in each survey or through the companies’ Web sites.
2
Auditors made the following decisions regarding the data:
AAggiinngg
ooff
ddaattaa——
Because the data from each survey was effective between
January and March 2008, auditors aged the data to December 2008, to coincide
with the end of the year. Auditors aged the data from each survey based on
SullivanCotter’s analysis of budgeted salary increases for hospitals and health
system executives for 2008 (3.5 and 4 percent, respectively). The data was aged
in proportion to the number of months between the data effective date and
December 2008.
CChhooiiccee
ooff
CChhiieeff
EExxeeccuuttiivvee
OOffffiicceerr
((CCEEOO))
ppoossiittiioonn——
Although the SullivanCotter
survey offered only one choice for the CEO position data, both Mercer and
Watson Wyatt Data Services offered multiple choices. Mercer offered two
choices—CEO of a standalone or system-owned hospital. Because Mercer
considers a single hospital, not owned by a healthcare provider system, with
multiple nonhospital facilities such as outpatient clinics and a health plan as a
standalone hospital, and auditors considered that this definition most closely
matched the District’s profile, auditors chose the CEO of a standalone hospital
Office of the Auditor General
page a-i
APPENDIX A
1
To perform their analyses, auditors used 2008 healthcare salary surveys from Mercer, SullivanCotter, and Watson Wyatt
Data Services. See Bibliography, pages c-i through c-iv, for additional details.
2
Although SullivanCotter does not provide online access to its survey, both Mercer and Watson Wyatt Data Services
provide Web site access at http://www.imercer.com/ and http://www.wwds.com/, respectively.

for their analysis. In the Watson Wyatt Data Services survey, there were four
choices—CEO of a multi-unit organization, an independent or subsidiary
hospital/facility, or a nonhospital facility. Auditors chose the multi-unit
organization position for their analysis because Watson Wyatt Data Services
defined it as the CEO of a healthcare organization with various hospitals and/or
facilities such as healthcare clinics, and auditors considered this definition most
similar to the District’s profile—a full-service teaching hospital with several
healthcare facilities, and two health plans.
CChhooiiccee
ooff
hhoossppiittaall
ttyyppeess——
For each analysis, auditors chose the healthcare
organization type that appeared to most closely match the District’s. As
indicated in the Introduction and Background (see pages 1 through 10), the
District’s integrated health system consists of a full-service teaching hospital,
several other healthcare facilities, and two health plans.
•
MMeerrcceerr——
This survey provided data for various hospital types, and auditors
determined that the teaching facility group was the most comparable to the
District because it included organizations that provide teaching programs
for medical students. However, for some comparisons, the survey restricted
the auditors’ choice to the general hospital group.
•
SSuulllliivvaannCCootttteerr——
This survey provided data for both hospitals and health
systems. Auditors chose the health system data because the survey’s
description of a Single Hospital System (one acute care hospital and
multiple healthcare-related entities, such as outpatient/ambulatory care)
appeared to most closely reflect the District’s profile.
•
WWaattssoonn
WWyyaatttt
DDaattaa
SSeerrvviicceess——
This survey provided a general hospital
group and various specific hospital types. Auditors chose the general
medical and surgical teaching hospitals group, which appeared to most
closely reflect the District’s profile. However
, for comparisons where
auditors used SullivanCotter’s data or Mercer’s general hospital group
data, auditors used Watson Wyatt Data Services’ general hospital group
data so the data would be more comparable.
CChhooiiccee
ooff
rreeggiioonnss——
In addition to comparing executive management salaries
nationally, auditors also compared salaries regionally. Because both Watson
Wyatt Data Services and Mercer define the South Central region to include
Arizona, Arkansas, Colorado, Louisiana, New Mexico, Oklahoma, Texas, and
Utah, auditors included this region in their analysis. However, auditors could not
perform a regional analysis using SullivanCotter’s health system data because
it lacked a regional breakdown of the data. At the District’s request, auditors also
included the West Coast region. Watson Wyatt Data Services defines the West
Coast region to include Alaska, California, Hawaii, Nevada, Oregon, and
Washington. Mercer includes these states in the West Coast region and adds
Idaho and a small northwestern portion of Arizona.
State of Arizona
page a-ii

CChhooiiccee
ooff
rreevveennuuee
iinnccrreemmeennttss——
Working within each survey’s confine, auditors
chose revenue increment amounts that most closely matched the District’s net
revenues. Net revenues are gross revenues less items that reduce total revenue,
such as bad debt (amounts that patients or insurers never paid). In fiscal year
2008, the District had $572 million in net revenues.
•
MMeerrcceerr——
The revenue increment amount available in this survey that most
closely matched the District’s was $400 million or more. This survey only
provides the ability to select revenue amounts for certain analyses. For
example, the survey restricted auditors from selecting revenue amounts
when comparing all hospitals nationally.
•
SSuulllliivvaannCCootttteerr——
This survey provides several revenue increments for any
analyses conducted for health systems. Auditors chose the $400 to $900
million increment as most comparable to the District’s.
•
WWaattssoonn WWyyaatttt DDaattaa SSeerrvviicceess——
Although the W
atson Wyatt Data Services
data was available in many different revenue increments, auditors chose
one similar to SullivanCotter’s to provide the most comparable data.
IInncclluussiioonn
ooff
tthhee
DDiissttrriicctt’’ss
ddaattaa——
The data used in the tables for two of the three
surveys—Mercer and Watson Wyatt Data Services—includes the District’s data
within the reported amounts from all hospitals. Because of these companies’
confidentiality policies, auditors were unable to obtain the survey data with the
District’s data removed.
UUnnrreeppoorrtteedd
ddaattaa——
To maintain client confidentiality, the survey firms do not
report data in a category where fewer than five participants respond. The dashes
in each table represent where this has occurred.
UUssee
ooff
mmeeddiiaann
ssaallaarriieess——
Although a variety of measures are available for each
survey, auditors predominantly chose the median salary because it is the value
that has an equal number of values above and below it, thereby eliminating the
influence of any extremely high or low values. However, in one instance, auditors
chose the 25th percentile because the comparable hospital grouping for that
survey included hospitals with net revenues extending to more than $1.5 billion,
which auditors felt would inflate the salary data and make it incomparable (see
Table 17, pages a-iv through a-v).
In addition to the analyses presented in Chapter 3, pages 33 through 38, auditors
performed the analyses on Table 17 (see pages a-iv through a-v) by comparing the
District’s executives’ salaries to national healthcare facilities’ and teaching hospitals’
without consideration of net revenues, and hospitals’ executives’ salaries by region
both with and without considering net revenues.
Office of the Auditor General
page a-iii

State of Arizona
page a-iv
A: Comparison of the District’s Executives’ Salaries to Those of Selected Hospitals and Health Systems Nationally
Without Regard to Net Revenues
District Watson Wyatt Data Services
1
SullivanCotter Mercer
1
Position
Annual
Salary
Median
Annual
Salary
Number of
Organizations
Reporting
25
th
Percentile
Annual
Salary
2
Number of
Organizations
Reporting
Median
Annual
Salary
Number of
Organizations
Reporting
Chief Executive
Officer $367,600
$586,000 93 $540,400 192 $544,400 69
Chief Operating
Officer 330,000 292,500 130
331,700 137 195,700 317
Chief Medical
Officer
3
315,100 298,800 112 302,400 130 285,900 116
Chief Financial
Officer 305,000 274,000 204 295,500 200 179,800 460
Vice-President
Internal
Development
4
172,400 150,900 72 157,800 69 145,200 36
B: Comparison of the District’s Executives’ Salaries to Those of Selected Teaching Hospitals Nationally Without
Regard to Net Revenues
District Watson Wyatt Data Services
1
Mercer
1
Position
Annual
Salary
Median
Annual
Salary
Number of
Organizations
Reporting
Median
Annual
Salary
Number of
Organizations
Reporting
Chief Executive
Officer $367,600
$615,800 43 $584,700 52
Chief Operating
Officer 330,000 328,400 53 258,000 124
Chief Medical
Officer
3
315,100 323,300 51 307,900 74
Chief Financial
Officer 305,000
322,300 79 242,900 142
Vice-President
Internal
Development
4
172,400 199,000 28 144,300 25
C: Comparison of the District’s Executives’ Salaries to Those of Selected Hospitals Regionally Without Regard to Net Revenues
District Watson Wyatt Data Services
1
Mercer
1
South Central
5
West Coast
6
South Central
5
West Coast
6
Position
Annual
Salary
Median
Annual
Salary
Number of
Organizations
Reporting
Median
Annual
Salary
Number of
Organizations
Reporting
Median
Annual
Salary
Number of
Organizations
Reporting
Median
Annual
Salary
Number of
Organizations
Reporting
Chief Executive
Officer $367,600
$486,200 18 —
7
1 $620,900 11 — 2
Chief Operating
Officer 330,000 265,500 18 $192,600 8 170,800 81 $188,900 50
Chief Medical
Officer
3
315,100 331,000 14 361,800 6 259,000 22 302,200 14
Chief Financial
Officer 305,000 272,000 31 232,700 13 174,300 127 179,800 59
Vice-President
Internal
Development
4
172,400 200,700 7 209,400 6 — 3 162,400 6
(Continued)
Table 17: Additional Salary Comparison Information
As of December 2008
(Unaudited)

Office of the Auditor General
page a-v
D: Comparison of the District’s Executives’ Salaries to Those of Selected Hospitals Regionally with Similar Net Revenues
District Watson Wyatt Data Services
1,8
Mercer
1,8
South Central
5
West Coast
6
South Central
5
West Coast
6
Position
Annual
Salary
Median
Annual
Salary
Number of
Organizations
Reporting
Median
Annual
Salary
Number of
Organizations
Reporting
Median
Annual
Salary
Number of
Organizations
Reporting
Median
Annual
Salary
Number of
Organizations
Reporting
Chief Executive
Officer $367,600
$524,700 7 —
7
0 $625,400 7 —
1
Chief Operating
Officer 330,000 200,200 6 — 4 262,000 11 $294,500
9
Chief Medical
Officer
3
315,100 — 3 — 2 — 4 310,800
10
Chief Financial
Officer 305,000 297,600 11 $256,700 5 235,300 12
338,700
11
Vice-President
Internal
Development
4
172,400 — 2 — 4 — 1 189,100
5
Table 17: Additional Salary Comparison Information
As of December 2008
(Unaudited)
(Concluded)
1
Salary survey data includes the District’s data that could not be removed because of survey firm client confidentiality policies. See page a-iii for further
details.
2
The 25th percentile instead of the median annual salary was used to make a more appropriate comparison. See page a-iii for further details.
3
In February 2008, the District’s Chief Medical Officer retired at an annual salary of $315,100. Subsequent to his retirement until October 2008, a contracted
physician filled this position on an interim basis at an estimated annual salary of $229,100. As of December 2008, this position remained vacant.
4
In December 2008, the District changed the responsibilities and title for this position to the Senior Vice-President and Chief External Affairs Officer with an
approximate annual salary of $209,700.
5
Watson Wyatt Data Services and Mercer both define the South Central region as including Arizona, Arkansas, Colorado, Louisiana, New Mexico,
Oklahoma, Texas, and Utah.
6
Watson Wyatt Data Services defines the West Coast region as including Alaska, California, Hawaii, Nevada, Oregon, and Washington. Mercer includes
these states in the West Coast region and adds Idaho and a small northwestern portion of Arizona.
7
The survey companies do not report data in a category when there are fewer than five organizations reporting.
8
Watson Wyatt Data Services data was based on hospitals with net revenues of $400 million to $900 million whereas Mercer data was based on hospitals
with net revenues of $400 million or more. See above for further details.
Source: Auditor General staff analysis of district-provided executive salary information and Mercer, SullivanCotter, and Watson Wyatt Data Services salary
survey data.

State of Arizona
page a-vi

Methodology
As set forth in Laws 2008, Chapter 288, §22, audit work focused on six areas within
the Maricopa County Special Health Care District (District). General methods used
included interviews with the District’s Board of Directors, management, and staff;
reviews of district documents such as the Board of Directors’ policy statements and
meeting minutes; and an analysis of applicable state and federal laws.
In addition, auditors used the following specific methods:
To identify and examine the financial, administrative, and operational issues of
the District and identify changes required to ensure financial stability, auditors
analyzed the District’s financial documents and practices and compared them
to information and practices in literature.
1
To select literature, auditors consulted
with experts and reviewed various books, articles, audits, reports, and
organizations’ Web sites. To assess financial stability, auditors analyzed the
District’s audited financial statements and financial indicators, such as “days
cash on hand,” and compared them over time to the District’s goals, which are
based on median values reported by Standard & Poor’s, a bond rating agency.
To determine steps needed to ensure financial stability and to determine future
financial needs, auditors interviewed district officials and reviewed literature,
statutes, and district documents such as its strategic plan, internal reports,
board meeting minutes, and policies. In addition, auditors reviewed consultant
reports to identify previous findings and recommendations related to the
District’s financial stability and facilities.
To identify the amount of funds generated through the District’s taxing authority
and how these monies were used, auditors obtained annual tax levy reports
from the Maricopa County Assessor’s Office and Finance Department Web sites
and data from the District’s audited financial statements, reviewed applicable
statutes, and obtained and reviewed various voter documents related to
establishing the District and its Board of Directors.
1
For these literature citations, see footnotes in Chapter 2 and Appendix C, the bibliography.
Office of the Auditor General
APPENDIX B
page b-i

To examine the District’s management salaries, auditors reviewed literature and
interviewed an expert and district personnel to identify leading national salary
surveys and key executive positions. Auditors then purchased three national
salary surveys to use to compare the District’s executive salaries to national
salary data.
1
(For a detailed explanation of survey analysis methodology, see
Appendix A, pages a-i through a-iii). In addition, auditors interviewed district
human resources personnel and legal counsel, and reviewed district information
related to employee compensation and other benefits, including retirement
plans and compensation literature, to identify the total compensation provided
to the District’s executive management positions. In addition, to compare the
District’s executive management salaries in 2008 to the salaries of comparable
contracted positions at the District’s inception in January 2005 and comparable
positions for Maricopa County in 2004 prior to the District’s inception, auditors
obtained and analyzed various district and Maricopa County documents.
To examine contract personnel and associated costs, auditors reviewed district
information for payments made to vendors to identify key personnel contracts.
Auditors’ work in this area then focused on the District’s two largest personnel
contracts: MedPro for physicians and allied healthcare professionals, and
Broadlane for temporary nursing staff. To evaluate whether the staffing structure
used for its doctors, allied healthcare professionals, and nurses was consistent
with and necessary for executing the District’s statutory duties, auditors
interviewed district management, obtained and reviewed various documents
such as contracts, and reviewed literature related to physician staffing models
and use of temporary nurses. Auditors also reviewed various documents,
including the District’s performance improvement plan and policies, to obtain
information on the steps the District or its contractors take to ensure quality
physicians are hired, quality patient care standards are followed, and costs are
controlled.
To identify all sources and uses of district funding, auditors analyzed and
reconciled the District’s detailed financial data to its audited financial statements
for fiscal years 2005 through 2008. Auditors also obtained various district
documents and other state and federal documents to develop descriptions of
each revenue source. Finally, auditors used the District’s 2008 and 2009 budget
documents, an Arizona Department of Health Services contract, Arizona
Healthcare Cost Containment System (AHCCCS) data, and state appropriation
reports to explain the District’s revenue changes over time.
To examine the amount of medical services that indigent individuals who are
uninsured have received from the District and to determine if policies have
changed to restrict services to this population, auditors reviewed board meeting
minutes to determine if the Board requested or voted on any policy changes. In
addition, auditors obtained and reviewed Maricopa County’s charity care
policies in place before the District was established as well as the District’s
1
For national salary survey information see Footnote 1, page 33.
State of Arizona
page b-ii

policy and other documents related to its Copa Care (charity care) program,
including fee schedules. In addition, to gather information about the population
that is served by the District’s Copa Care program and any uncompensated
medical care costs, auditors obtained and analyzed unaudited data from the
District’s billing and accounting systems.
To examine the amount of uncompensated care provided by the District,
auditors interviewed members of the District’s Board of Directors and
management, an AHCCCS official, a Joint Legislative Budget Committee
(JLBC) analyst, and e-mail correspondence with an official from the federal
Centers for Medicare and Medicaid Services (CMS). Auditors also obtained and
analyzed AHCCCS and CMS data to determine the uncompensated care costs
reported by and the amount of Medicaid Disproportionate Share Hospital (DSH)
payments distributed to the District, qualified private hospitals, and the State in
fiscal years 2000 through 2008. To obtain a historical perspective on how the
DSH monies have been distributed, auditors also reviewed AHCCCS and JLBC
documents, various legal documents, and federal and state laws.
To develop information for the Introduction and Background, auditors reviewed
voter documents relating to the District, Web site descriptions of each district
component such as the hospital and burn center, contract information, district
staffing documents, and information from the District’s audited financial
statements for fiscal years 2005 through 2008.
Office of the Auditor General
page b-iii

State of Arizona
page b-iv

Bibliography
American Association of Colleges of Nursing. (2002). Hallmarks of the professional
nursing practice environment. Retrieved December 30, 2008, from http://www.
aacn.nche.edu/publications/positions/hallmarks.htm
American Hospital Association. (2008). Fast facts on US hospitals. Retrieved
November 11, 2008, from http://www.aha.org/aha/resource-center/Statistics-
and-Studies/fast-facts.html
Berger, S. H. (2005). The power of clinical and financial metrics: Achieving success
in your hospital. Chicago: Health Administration Press.
Bokhour, B.G., Burgess, J.F., Hook, J.M., White, B., Berlowitz, D., Guldin, M.R., et al.
(2006). Incentive implementation in physician practices: A qualitative study of
practice executive perspectives on pay for performance. Medical Care Research
and Review, 63, 73S-95S. Retrieved November 4, 2008, from http://mcr.sage-
pub.com.
Burns, L.R., Morrisey, M.A., Alexander, J.A., and Johnson, V. (1998). Managed care
and processes to integrate physicians/hospitals [Electronic version]. Health
Care Management Review, 23(4), 70-80.
Cuellar, A.E., & Gertler, P.J. (2006). Strategic integration of hospitals and physicians.
Journal of Health Economics, 25, 1-28. doi:10.1016/j.jhealeco.2005.04.009
Flannery, T.P. (Ed.). (2002). Executive compensation: Guidelines for healthcare
leaders and trustees. Chicago: Health Administration Press.
Flex Monitoring Team. (2005). Financial indicators for critical access hospitals.
Retrieved December 15, 2008, from http://www.flexmonitoring.org/documents/
BriefingPaper7_FinancialIndicators.pdf
Office of the Auditor General
APPENDIX C
page c-i

Gaynor, M., Rebitzer, J.B., & Taylor, L.J. (2004). Physician incentives in health
maintenance organizations [Electronic version]. Journal of Political Economy,
112, 915-931.
Green, M.A., & Bowie, M.J. (2005). Essentials of heath information management:
Principles and practices. Clifton Park, NY: Thomson-Delmar Learning.
Hadley, J., Holahan, J., Coughlin, T., & Miller, D. (2008). Covering the uninsured in
2008: A detailed examination of current costs and sources of payment, and
incremental costs of expanding coverage. Retrieved November 4, 2008, from
www.kff.org
Health Management Associates. (2006). The Maricopa Integrated Health System: A
strategic review. Retrieved January 7, 2009, from http://www.mihs.org/docs/
MIHSStrategicPlan.pdf
Healthcare Financial Management Association. (2003). Financing the future I, report
1: How are hospitals financing the future? Access to capital in health care today.
Retrieved December 4, 2008, from http://www.hfma.org/NR/rdonlyres/2E95F3
D0-B095-4F04-8AA1-AAE264109806/0/FNF1_No1.pdf
Healthcare Financial Management Association. (2005a). Financing the future II,
report 1: Seven principles of best practice financial management. Retrieved
December 4, 2008, from http://www.hfma.org/NR/rdonlyres/FA799D7C-BE4E-
451A-A299-756661747A01/0/FNF2_No1.pdf
Healthcare Financial Management Association. (2005b). Financing the future II,
report 3: Essentials of integrated strategic financial planning and capital
allocation. Retrieved December 4, 2008, from http://www.hfma.org/NR/rdonlyres
/172B68E6-DFE3-46AA-8CA8-845BA85B4D5C/0/FNF2_No_3.pdf
Healthcare Financial Management Association. (2006a). Financing the future II,
report 5: Strategies for financially distressed hospitals. Retrieved December 4,
2008, from http://www.hfma.org/NR/rdonlyres/F994EA9F-BD9F-4C6F-
B6D4FD14AEB81C23/0//FF2_No5_Strategies_w1.pdf
Healthcare Financial Management Association. (2006b). Financing the future II,
report 6: The outlook for capital access and spending. Retrieved November 17,
2008, from http://www.hfma.org/NR/rdonlyres/89EAB955-E316-4E64-B771-
C1DCB12AB95A/0/FF2_No6.pdf
Healthcare Financial Management Association. (2007). Make the most of key
hospital financial metrics. Retrieved December 19, 2008, from http://www.hfma.
org/publications/know_newsletter/030707.htm
Ingenix. (2007). Almanac of hospital financial & operating indicators. Salt Lake City:
Ingenix.
State of Arizona
page c-ii

Kaufman, K. V. (2006). Best practice financial management: Six key concepts for
healthcare leaders (3rd ed.). Chicago: Health Administration Press.
Kongstvedt, P.R. (Ed.). (2001). The managed healthcare handbook. (4th ed.).
Gaithersburg, Maryland: Aspen.
Mallon, W.T. (2004). The handbook of academic medicine: How medical schools and
teaching hospitals work. Washington, D.C.: Association of American Medical
Colleges.
Mercer (US) Inc. (2008). Integrated health networks compensation survey : Module
4-B—healthcare provider facility executives & management. Louisville, KY:
Mercer (US), Inc.
National State Auditors Association, (2003, June). Contracting for services: A national
state auditors association best practices document. Retrieved January 5, 2009,
from http://www.nasact.org/onlineresources/downloads/BP/06_03Contracting_
Best_Practices.pdf
Needleman, J. (2003). Assessing the financial health of hospitals. In R. Wienick & J.
Billings (Eds.), Tools for monitoring the health care safety net. Retrieved
December 15, 2008, from http://www.ahrq.gov/data/safetynet/needleman.htm
Nowicki, M. (2004). The financial management of hospitals and healthcare
organizations (3rd ed.). Chicago: Health Administration Press.
Price Waterhouse Coopers. (2003). Cost of caring: Key drivers of growth in spending
on hospital care. Retrieved December 30, 2008, from http://www.aha.org/aha/
content/2003/pdf/PwCcostsReport.pdf
Reis, P. (Ed.). (2005). Contracted staff and patient safety. Oakbrook Terrace, IL: Joint
Commission Resources.
Stiehl, R. R. (2004). Quality assurance requirements for contract/agency nurses.
JONA’s Healthcare Law, Ethics, and Regulation, 6(3), 69-74. Retrieved from
www.ovid.com.
Sullivan, Cotter and Associates, Inc. (2008). 2008 Survey of manager and executive
compensation in hospitals and health systems. Chicago: Sullivan, Cotter and
Associates, Inc.
3D/International. (2006). Facilities assessment report: Maricopa Integrated Health
Systems all facilities Maricopa County, Arizona.
Office of the Auditor General
page c-iii

Torgerson, P.M. (2008). Gain-Sharing with the hospital: What is possible in the
current legal environment. Orthopedic Clinics of North America, 39, 33-36.
doi:10.1016/j.ocl.2007.09.008
Vogenberg, F.R., Lichtig, L.K., Weinberg, R.M., & DeSantis, V. (2004). Balancing
physician and cost-containment demands. Healthcare Financial Management,
66-72. Retrieved from www.hfma.org
Watson Wyatt Data Services. (2008). 2008/2009 Survey report on health care
executive management personnel compensation. Rochelle Park, NJ: Watson
Wyatt Data Services.
Weiner, B.J., Culbertson, R., Jones, R.F., & Dickler, R. (2001). Organizational models
for medical school-clinical enterprise relationships. Academic Medicine, 76,
113-124. Retrieved January 6, 2009, from http://www.case.edu/menu/partner-
ship/Weiner.pdf
Williams, J. (2008). A team approach to cost containment. Healthcare Financial
Management, 51-58. Retrieved from www.hfma.org
State of Arizona
page c-iv

Office of the Auditor General
AGENCY RESPONSE

State of Arizona

Performance Audit Division reports issued within the last 24 months
Future Performance Audit Division reports
Arizona Sports and Tourism Authority
State Compensation Fund
07-13 Arizona Supreme Court,
Administrative Office of the
Courts—Juvenile Treatment
Programs
08-01 Electric Competition
08-02 Arizona’s Universities—
Technology Transfer Programs
08-03 Arizona’s Universities—Capital
Project Financing
08-04 Arizona’s Universities—
Information Technology Security
08-05 Arizona Biomedical Research
Commission
08-06 Board of Podiatry Examiners
09-01 Department of Health Services,
Division of Licensing Services—
Healthcare and Child Care
Facility Licensing Fees
09-02 Arizona Department of Juvenile
Corrections—Rehabilitation and
Community Re-entry Programs
07-01 Arizona Board of Fingerprinting
07-02 Arizona Department of Racing
and Arizona Racing Commission
07-03 Arizona Department of
Transportation—Highway
Maintenance
07-04 Arizona Department of
Transportation—Sunset Factors
07-05 Arizona Structural Pest Control
Commission
07-06 Arizona School Facilities Board
07-07 Board of Homeopathic Medical
Examiners
07-08 Arizona State Land Department
07-09 Commission for Postsecondary
Education
07-10 Department of Economic
Security—Division of Child
Support Enforcement
07-11 Arizona Supreme Court,
Administrative Office of the
Courts—Juvenile Detention
Centers
07-12 Department of Environmental
Quality—Vehicle Emissions
Inspection Programs
